


Contact Center Analysis
The application enables you to analyze the quality of service for incoming inquiries and reduce staffing and equipment costs through workload planning.
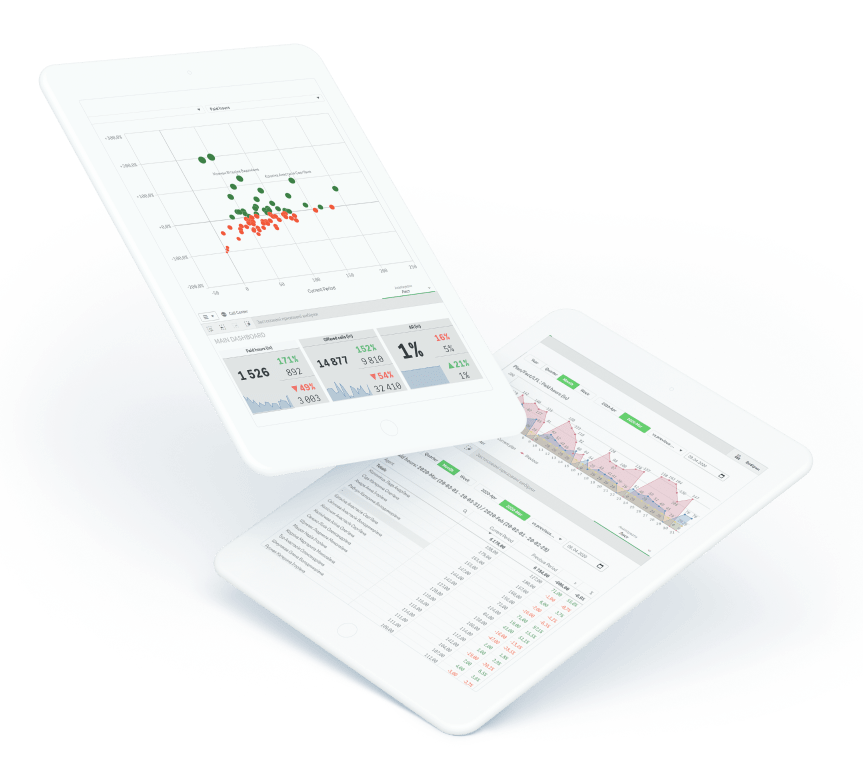

The preconfigured "Contact Center Analytics" solution allows you to analyze key performance indicators for the contact center based on selected time periods, track agent performance, identify seasonal trends in the volume of inquiries, broken down by inquiry topic and other parameters, analyze the average call handling time, the number of successful transactions initiated by agents, and the number of new leads over a specific time period, broken down by acquisition channel
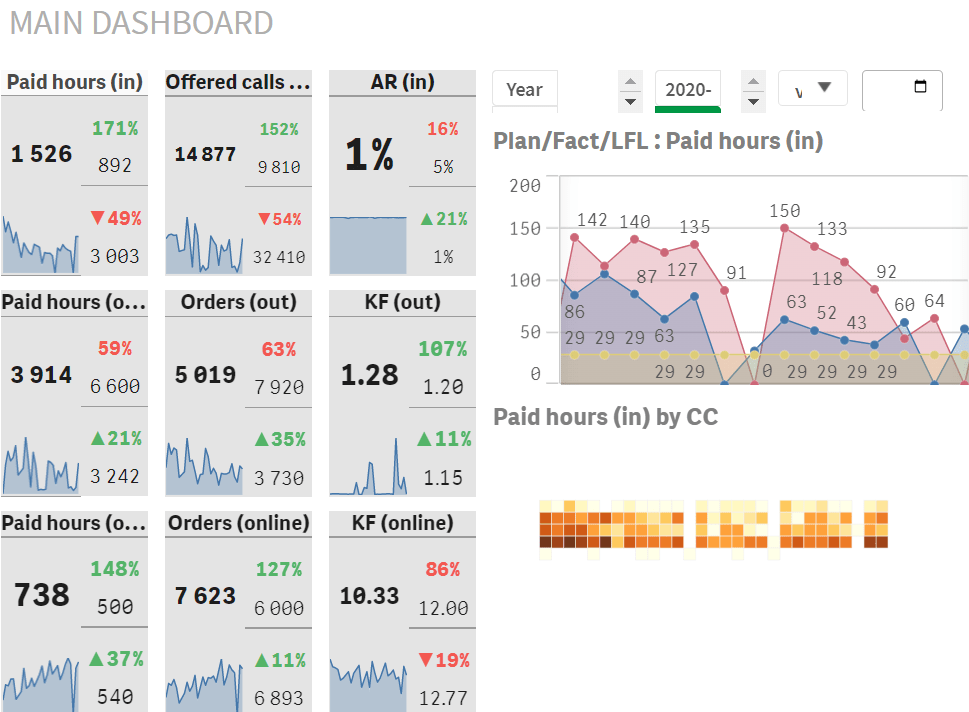
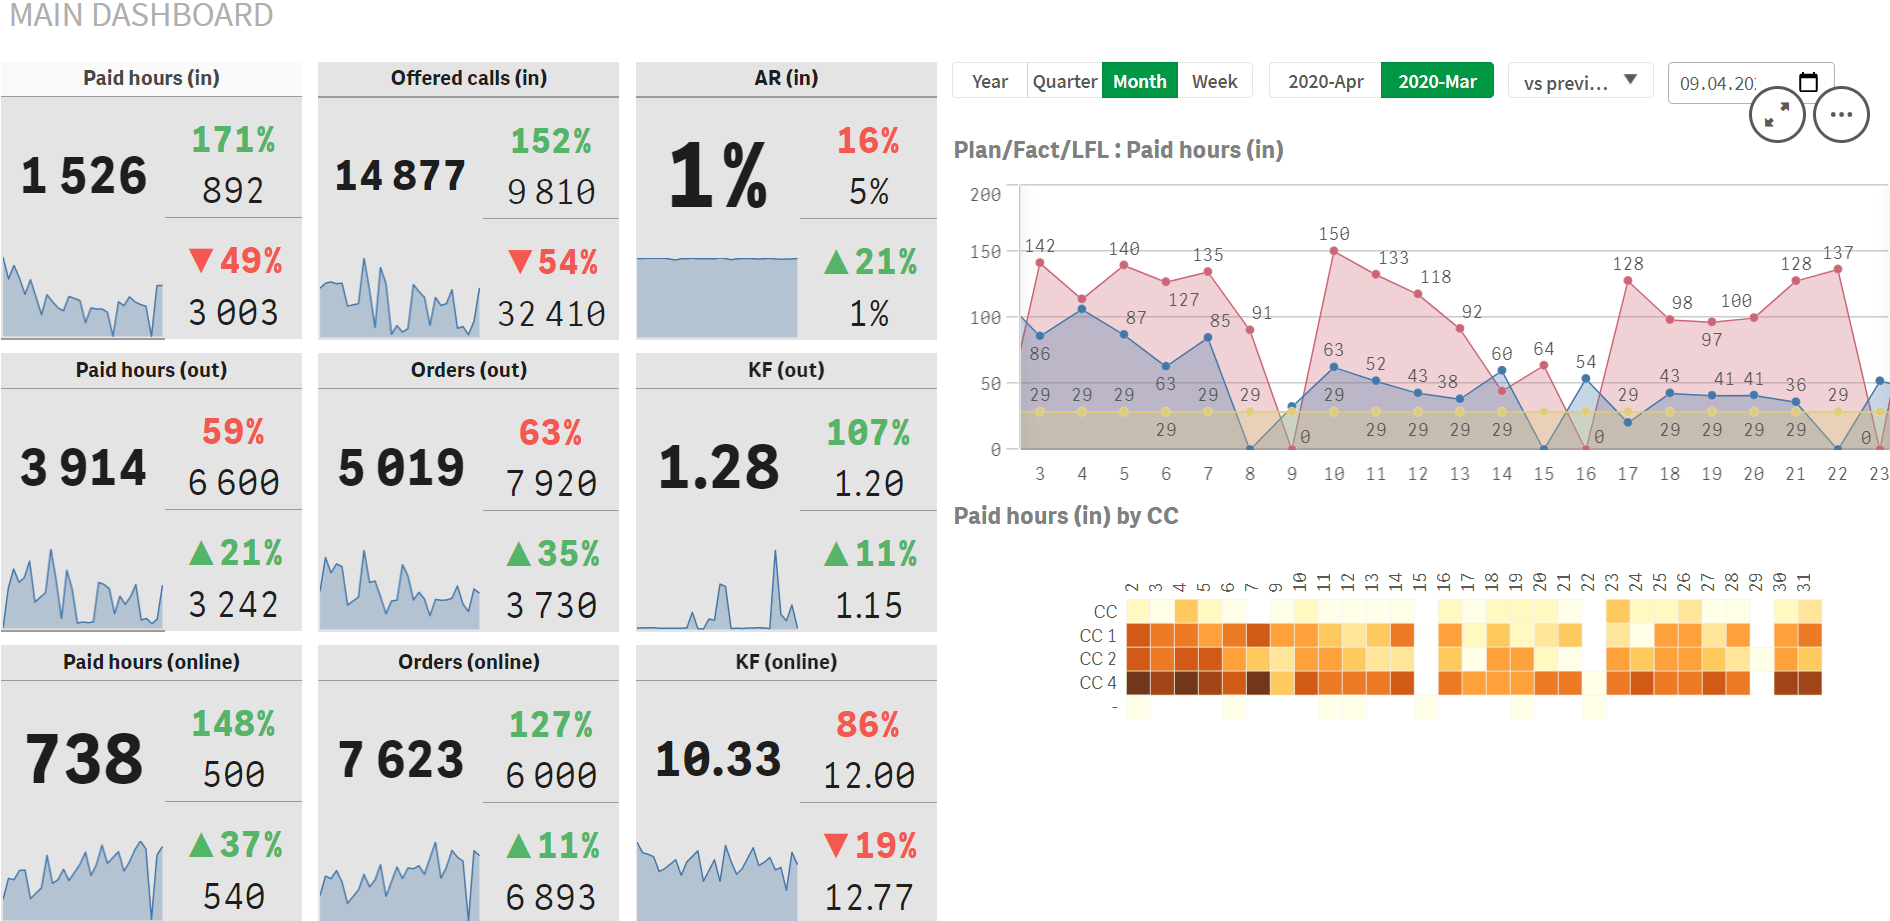
- Dashboard with key metrics and LFL analysis for each of the three categories: incoming calls, outgoing calls, and online orders
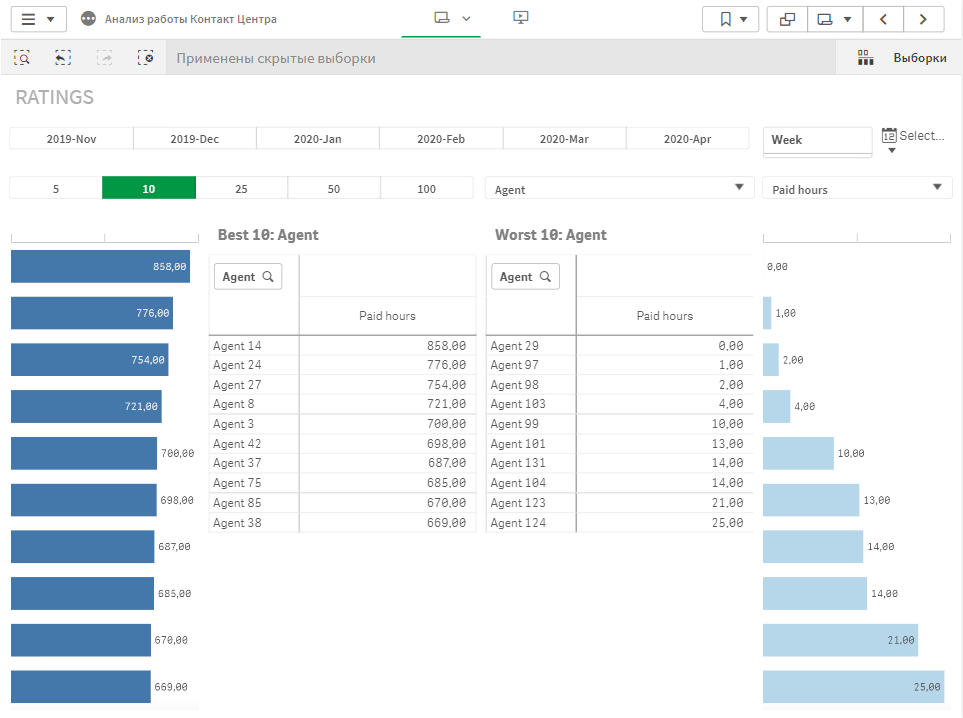
- Generating rankings of the top best/worst based on any selected metric for any given period
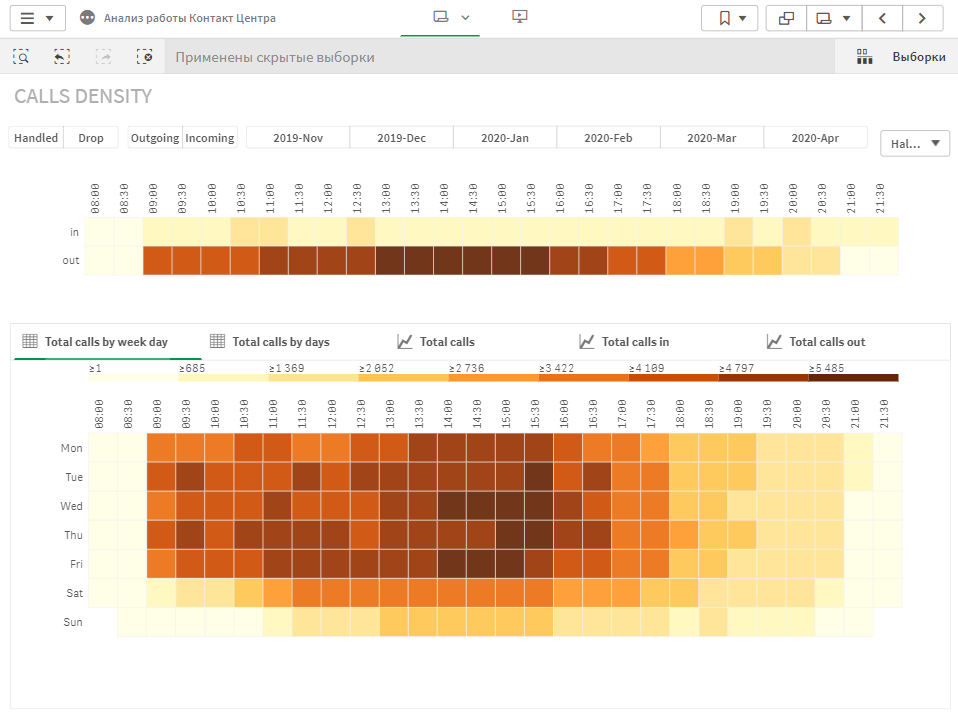
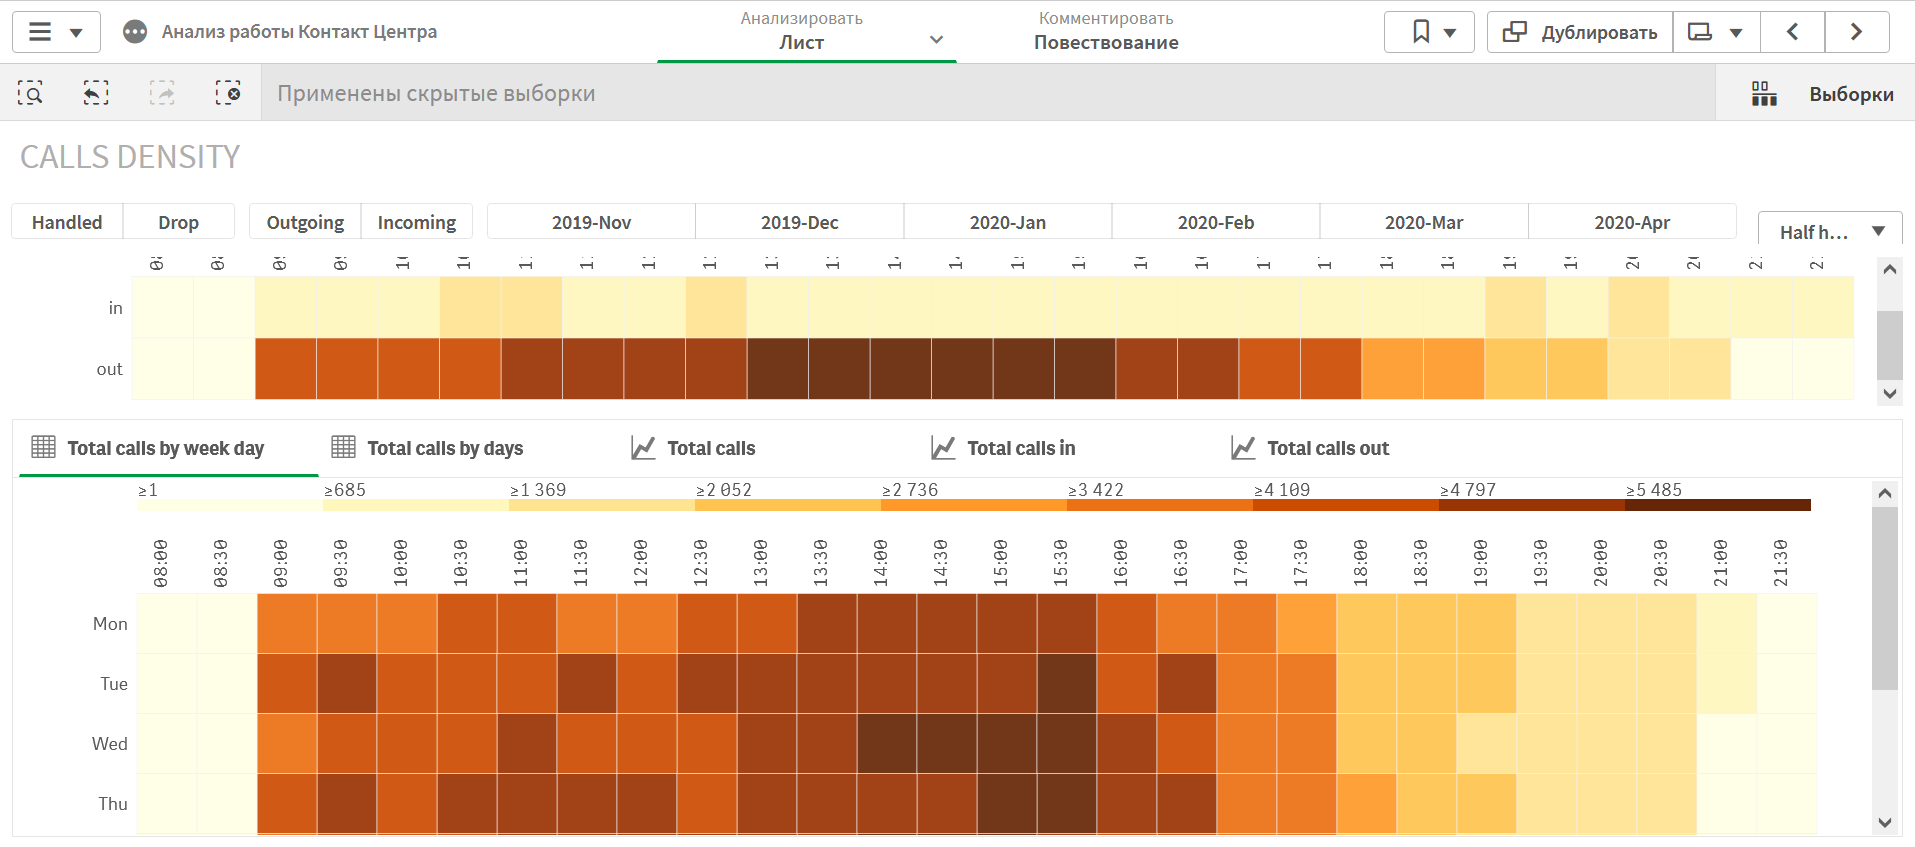
- Analysis of the number of calls to the contact center (inbound or outbound), with the option to configure time intervals by hour of the day and day of the week
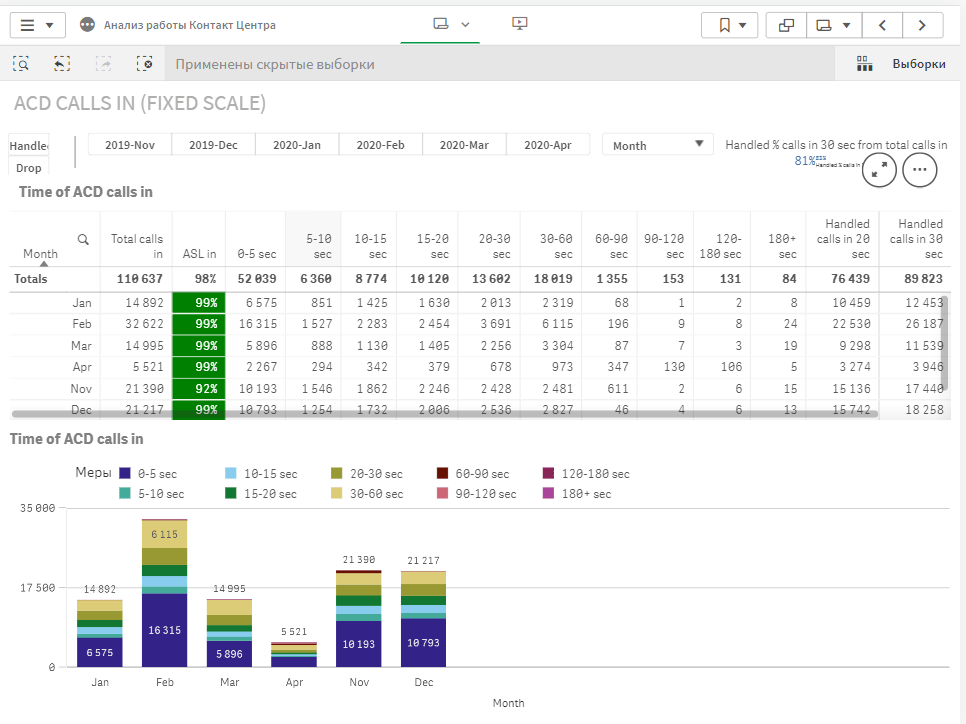
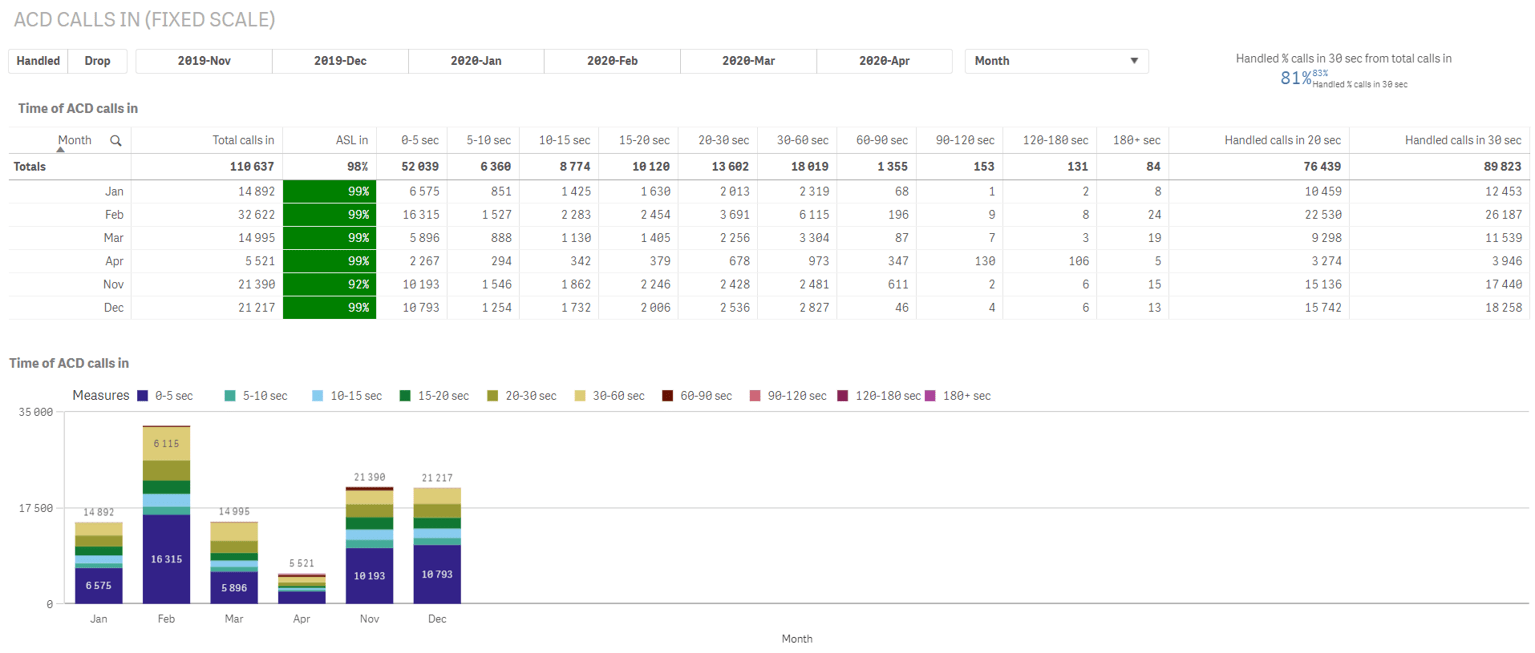
- Analysis of on-hold wait times by customizable intervals
- Dynamic and structural analysis of waiting times
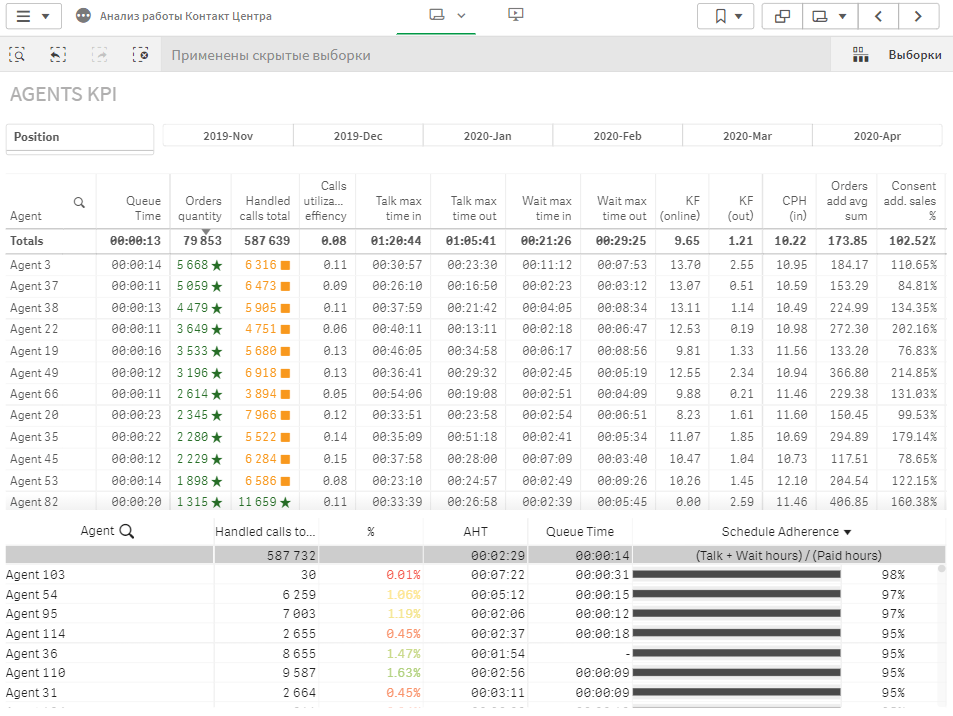
- average wait time on the line
- number of orders processed
- number of calls received
- conversion and recycling, etc.
- Dashboard with key metrics and LFL analysis for each of the three categories: incoming calls, outgoing calls, and online orders
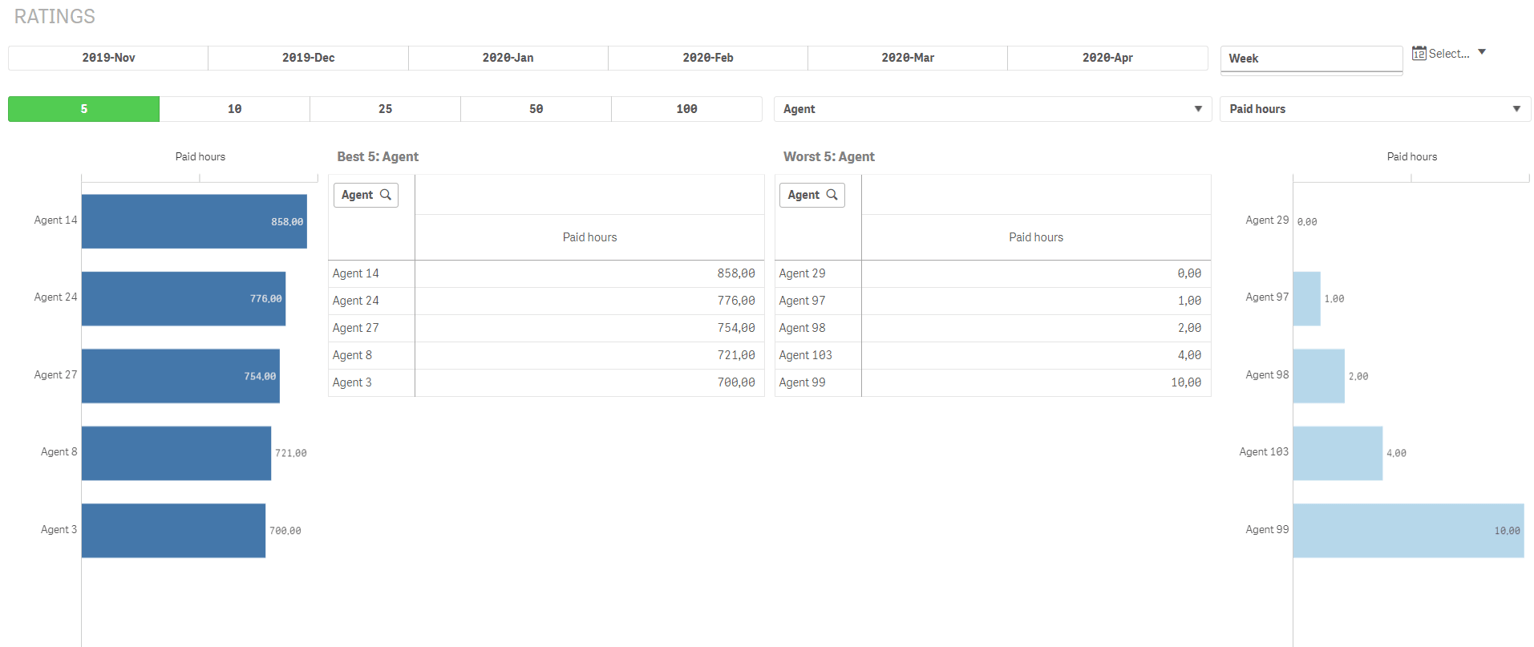
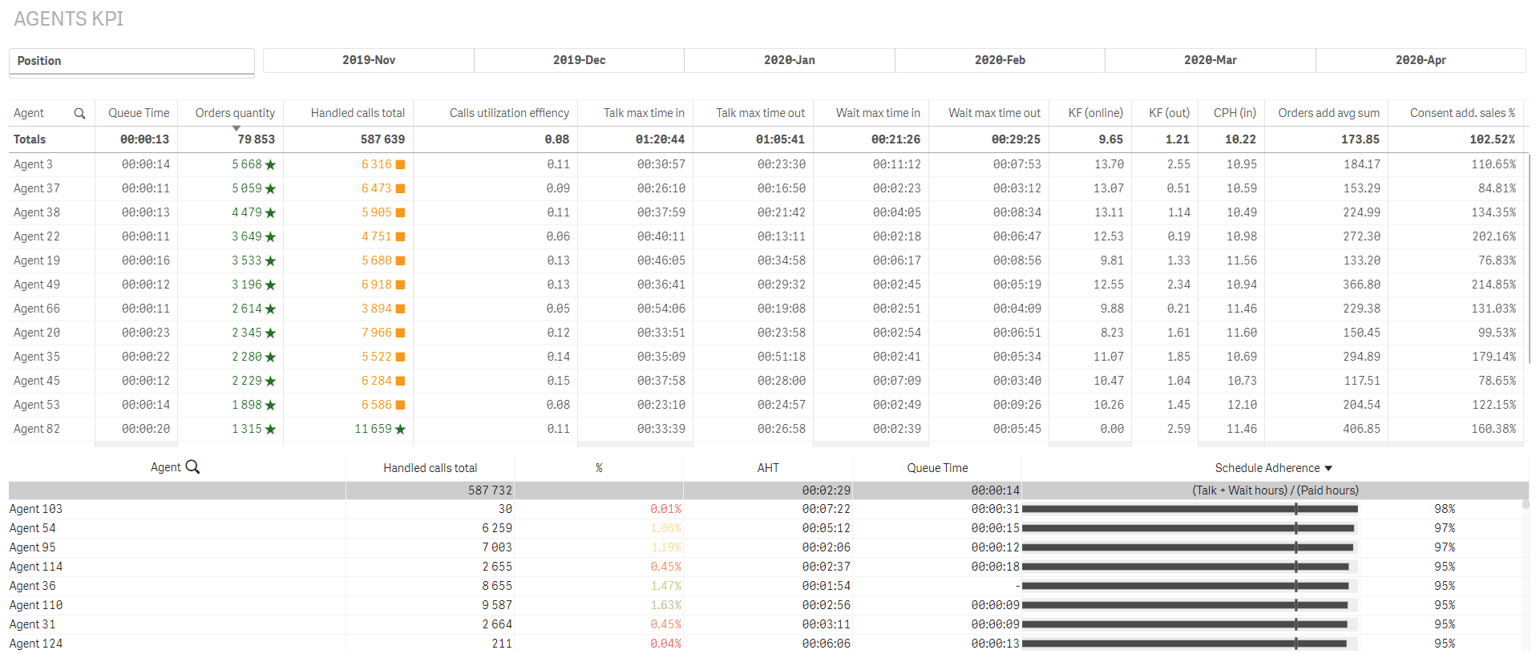
- Generating rankings of the top best/worst based on any selected metric for any given period
- Analysis of the number of calls to the contact center (inbound or outbound), with the option to configure time intervals by hour of the day and day of the week
- Analysis of on-hold wait times by customizable intervals
- Dynamic and structural analysis of waiting times
- average wait time on the line
- number of orders processed
- number of calls received
- conversion and recycling, etc.


RBC Group helps companies leverage data at every level—from integration and preparation to analytics, forecasting, and artificial intelligence. Its solutions cover four key areas of data management.






Contact Center Analysis
Call center analytics is the process of tracking key performance indicators to improve the customer experience and boost business productivity. It helps assess customer satisfaction levels, the quality of customer interactions, and the convenience and accessibility of services. Call center analytics provides a comprehensive, real-time view of the center’s performance across all interaction channels, allows for assessing trends in service quality, and enables proper planning of agent workload.
What are the main challenges faced by call center analysts?
Analyzing contact centers without analytical tools designed specifically for this type of activity is a challenging task due to the large amount of specific, scattered data:
- several customer interaction channels and data sources;
- a fluctuating volume of calls. The call center’s workload can vary throughout the day and may also depend on advertising campaigns or the launch of a new product;
- a complex system for evaluating employee performance.
Key performance indicators (KPIs) for contact centers include:
- billed hours;
- wait time;
- number of incoming calls;
- call handling time;
- conversion rate;
- number of calls answered, broken down by hour;
- average time required to serve a single customer.
KPIs make it possible to assess the overall performance of a department and to identify specific employees based on their ratings. Regularly monitoring performance metrics is a time-consuming process, but it plays an important role in call center management.
How Does the Implementation of Business Analytics Affect Contact Center Operations?
Call center analytics is based on data obtained from CRM systems, telephony systems, Excel, social media, and other sources. The information is converted into the required format using customized transformation algorithms and is used to generate real-time reports and visualizations. Within the analytical solution, the customer service process can be analyzed in three areas:
- incoming calls;
- outgoing calls;
- processing online orders.
Call center analytics enable managers to quickly access important data and insights that allow them to monitor the company’s performance in meeting its commitments. Visualizing call volume data by the hour highlights the need to take measures to ensure sufficient staffing during peak periods, thereby reducing or even eliminating customer wait times. Performance rankings allow managers to evaluate agent performance, award bonuses, provide additional training, and implement incentive programs for underperforming employees.
This analytical solution allows contact center managers to access a dashboard with key KPIs at any time, which shows the performance of the department as a whole and its individual divisions. Analyzing metrics such as call volume and customer wait times on hold reveals how well the company is managing to accomplish its objectives with its available resources. Call center analytics help with workload planning, ensuring there are enough agents available throughout the day.
Implementing an analytics solution significantly streamlines the IT department’s work. The flexible platform enables a unified information hub. Data is imported from various sources and automatically transformed, ensuring high data quality. The accumulation of information over time does not affect response times when generating visualizations. Changes are promptly reflected on dashboards, to which responsible employees have direct access in accordance with their respective permissions and responsibilities.
The “Call Center Analysis” solution is a set of easy-to-understand reports containing real-time and historical information about call center operations, which can be analyzed at the company, department, or individual employee level. The data provided can be used by both front-line staff and managers who need to track their performance, reduce costs, and optimize efficiency.

