


AskQ
We created AskQ to make business analytics simple and accessible. It’s a smart bot that works within Qlik Sense and helps executives, analysts, and teams quickly get answers from their data. All you need is Qlik and GPT. Just ask a question—and AskQ will show you key metrics, explain what they mean, and suggest next steps.

AskQ – An AI-powered analytical bot based on ChatGPT
.
.responsive-video {
position: relative;
width: 100%;
padding-bottom: 56.25%; /* Співвідношення 16:9 */
height: 0;
overflow: hidden;
}
.responsive-video iframe {
position: absolute;
top: 0;
left: 0;
width: 100%;
height: 100%;
border: 0;
}

Reports were compiled manually, data was updated slowly, and every number had to be checked. As a result, a lot of effort—but little confidence in the results.

With the advent of business analytics in Qlik, Power BI, and other systems, it has become easier to see what’s going on. But to find answers, you still had to search, compare, and analyze the data yourself.

AskQ is changing the way we do things: just ask a question, and the AI analyzes the data, identifies patterns, and suggests a solution. No more guessing “why”—AskQ will explain and advise you on what to do.
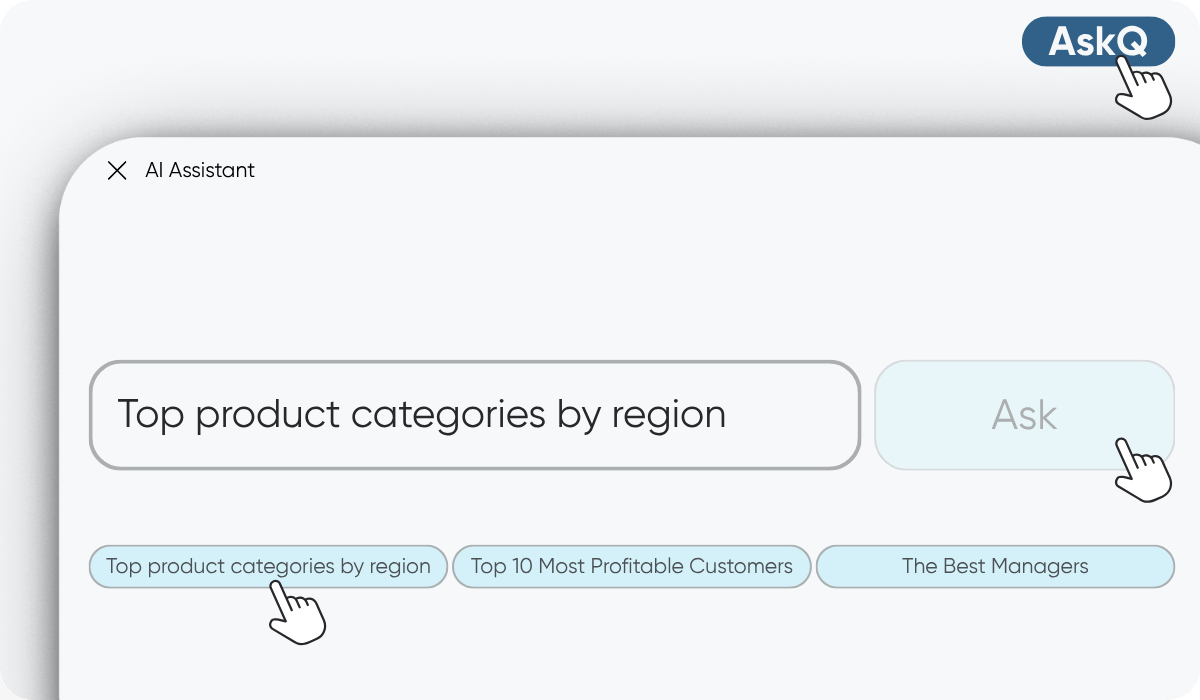
1. Click AskQ → select a pre-made query or type in your own words.
2. The AI recognizes your intent, applies the current filters, and generates a query for your data.
3. In a few seconds, you’ll receive a structured response:
— tables (top lists, breakdowns by region/category),
— key performance indicators (KPIs) and comparisons,
— trends/patterns (dynamics, peaks/troughs),
— brief text-based conclusions (what’s important right now).
4. You can immediately ask for more details: “calculate profit,” “add margin,” “make a forecast.”
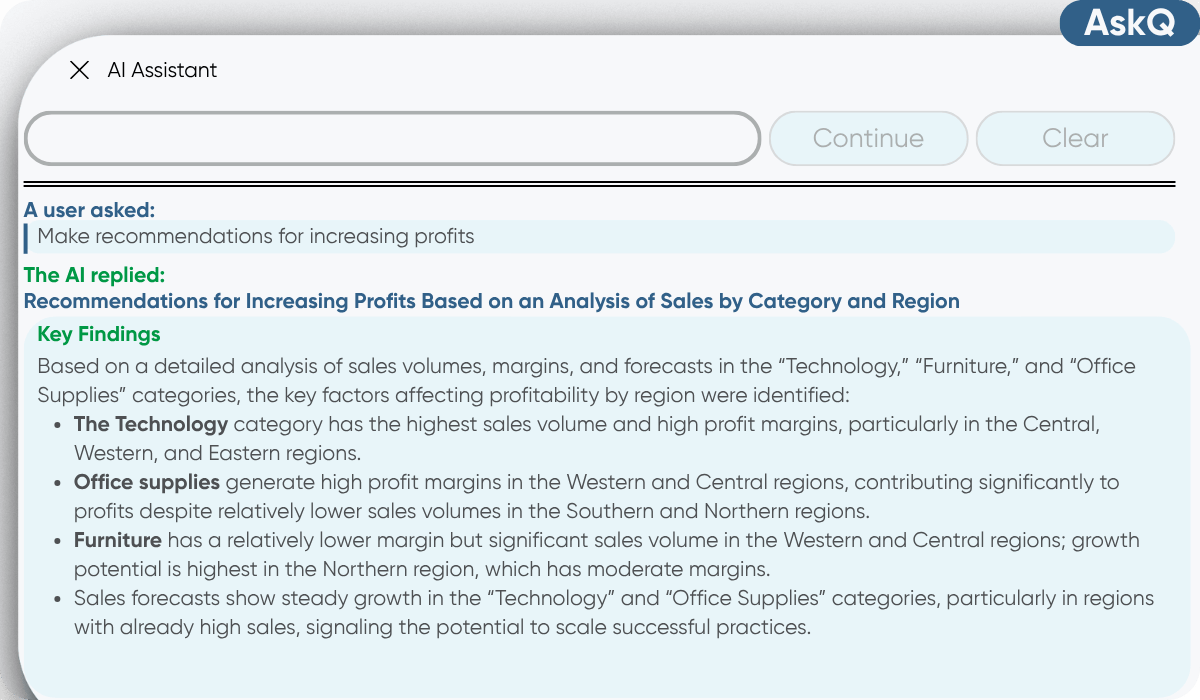
1. AI performs an in-depth analysis (e.g., ABC/XYZ, regional breakdown, profitability, LFL).
2. Explains why this happened: drivers of growth/decline, the impact of categories, regions, and managers.
3. Displays visualizations: graphs, charts, and tables for quick understanding.
4. Provides insights and recommendations: what to strengthen or optimize (SKUs, prices, inventory, channels, regions), and next steps for the team.
5. Generates a ready-to-use text summary (key takeaways) that can be inserted into an email, report, or presentation.
6. Suggests follow-up queries (for example: “Top 5 best/worst managers by profit,” “Show high-risk SKUs”).

AskQ uses artificial intelligence to simplify your interaction with data. Just ask a question in plain language—the AI will instantly understand the context and generate an accurate answer.
You get clear analytical insights without any technical knowledge.
AI processes queries in seconds and returns results in an easy-to-understand format: charts, tables, key metrics, explanations, insights, and recommendations.
Quick answers help you make informed decisions right now.

AskQ displays and analyzes data, identifies patterns, and explains why changes have occurred. AI adds business context and suggests next steps: how to increase profits, optimize resources, or improve efficiency.
It’s your smart assistant that turns data into action.


