


Analysis of Accounts Payable in Azerbaijan
The app helps improve financial ratios related to accounts receivable turnover. It assists in making informed management decisions regarding payments to suppliers and contractors in Azerbaijan


What is the company's total accounts payable?

What portion of the debt is past due?

Which suppliers account for the largest portion of the debt burden?

Which contracts or counterparties are consistently in default?

Which departments are most likely to experience payment delays?

What is the structure of the debt by aging categories?

On average, how many days does it take to settle the debt?

How has the debt changed compared to the previous period (LFL)?

Which suppliers require immediate payment?

Where is debt restructuring possible, and how does it affect the debt burden?

What scheduled payments are planned for each counterparty/contract?

What are the risks if the obligations are not paid off on time?
a BI platform


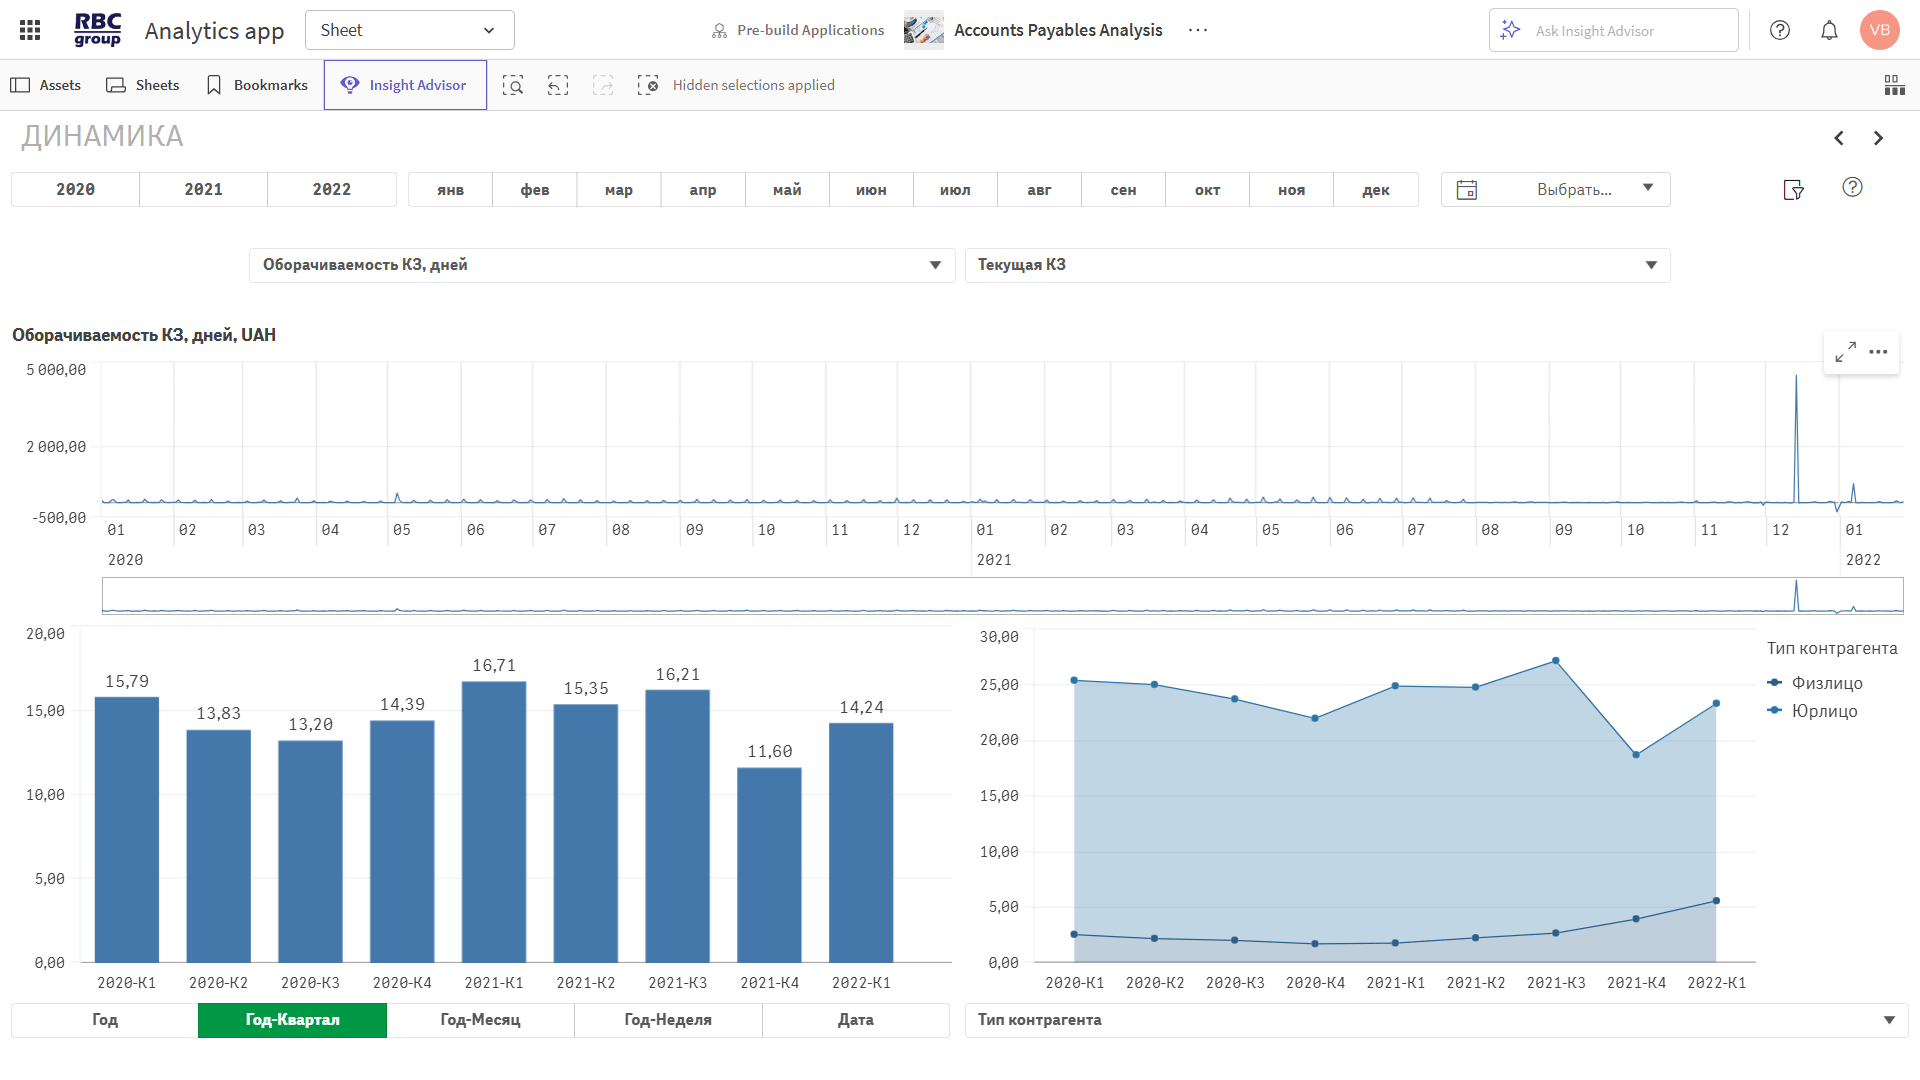
The solution enables a 360° analysis of accounts payable across all relevant dimensions: counterparties, contracts, vendors, branches, and managers. It allows for a detailed analysis of total, current, and average accounts payable, trends in the resolution of overdue payments, and accounts payable turnover.
"Accounts Payable Analysis" on the Power BI platform is a preconfigured solution that enables a 360° analysis of accounts payable across all relevant dimensions: counterparties, contracts, vendors, branches, and managers. The solution enables analysis of total, current, and average accounts payable, trends in the resolution of overdue payments, and accounts payable turnover.
These metrics allow you to assess the total amount of accounts payable, its trends, and the average balance.
◾ Total accounts payable — the sum of all current and past-due liabilities.
◾ Current accounts payable — liabilities for which the payment due date has not yet arrived.
◾ Past-due accounts payable (PPA) — obligations for which the payment deadline has passed.
◾ Average accounts payable — the average amount of debt over the period.
◾ Increase in accounts payable — the change in the amount of debt compared to the previous period.
◾ Accounts payable repayment — the total amount paid during the selected period.
◾ Days sales outstanding — the average time required to settle accounts with suppliers.
◾ % Overdue Accounts Payable — the proportion of overdue payments in the total amount.
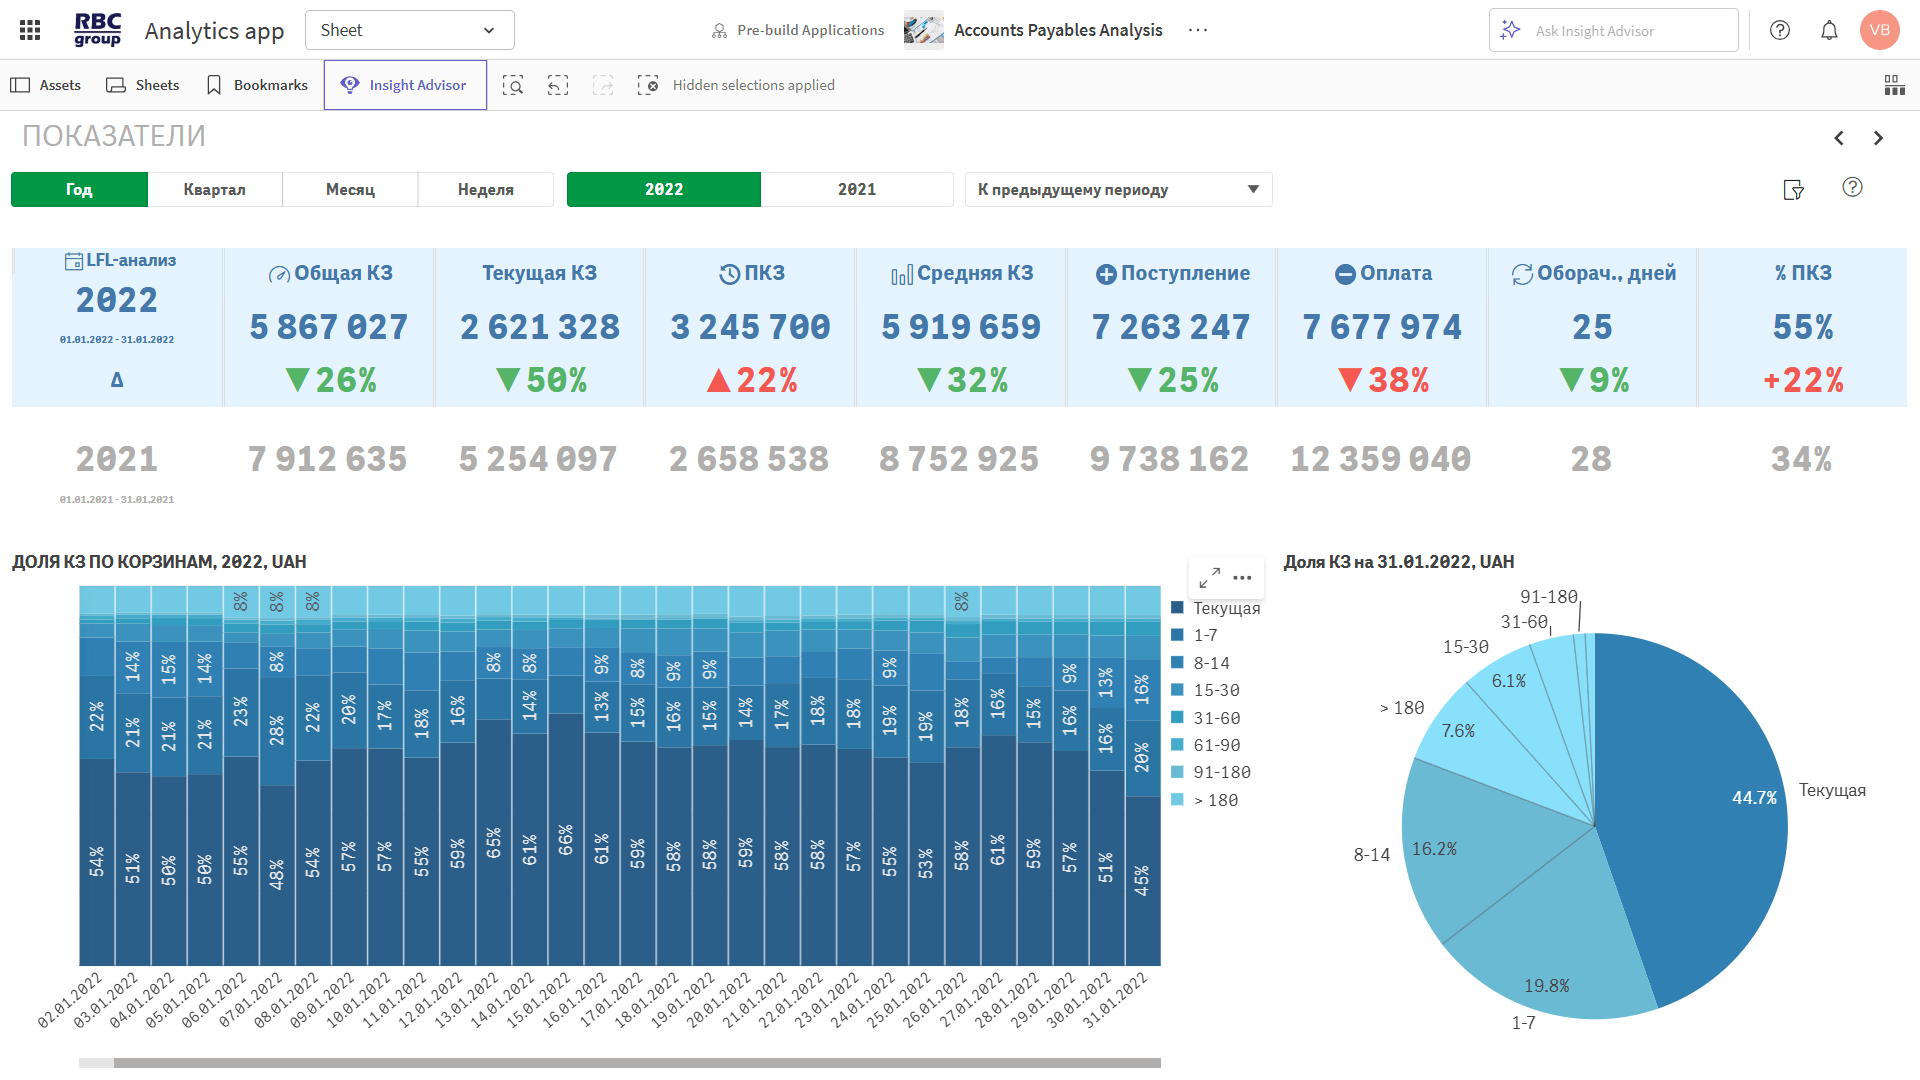
Analysis of accounts payable by due date and category.
◾ Trends by aging buckets—based on custom intervals.
◾ Accounts payable (AP) structure—by supplier, department, and contract.
◾ Share of accounts payable in total liabilities — contribution of different segments.
◾ LFL analysis — comparison of accounts payable with the same period last year.
◾ Comparison of planned vs. actual payments — monitoring of obligation fulfillment.
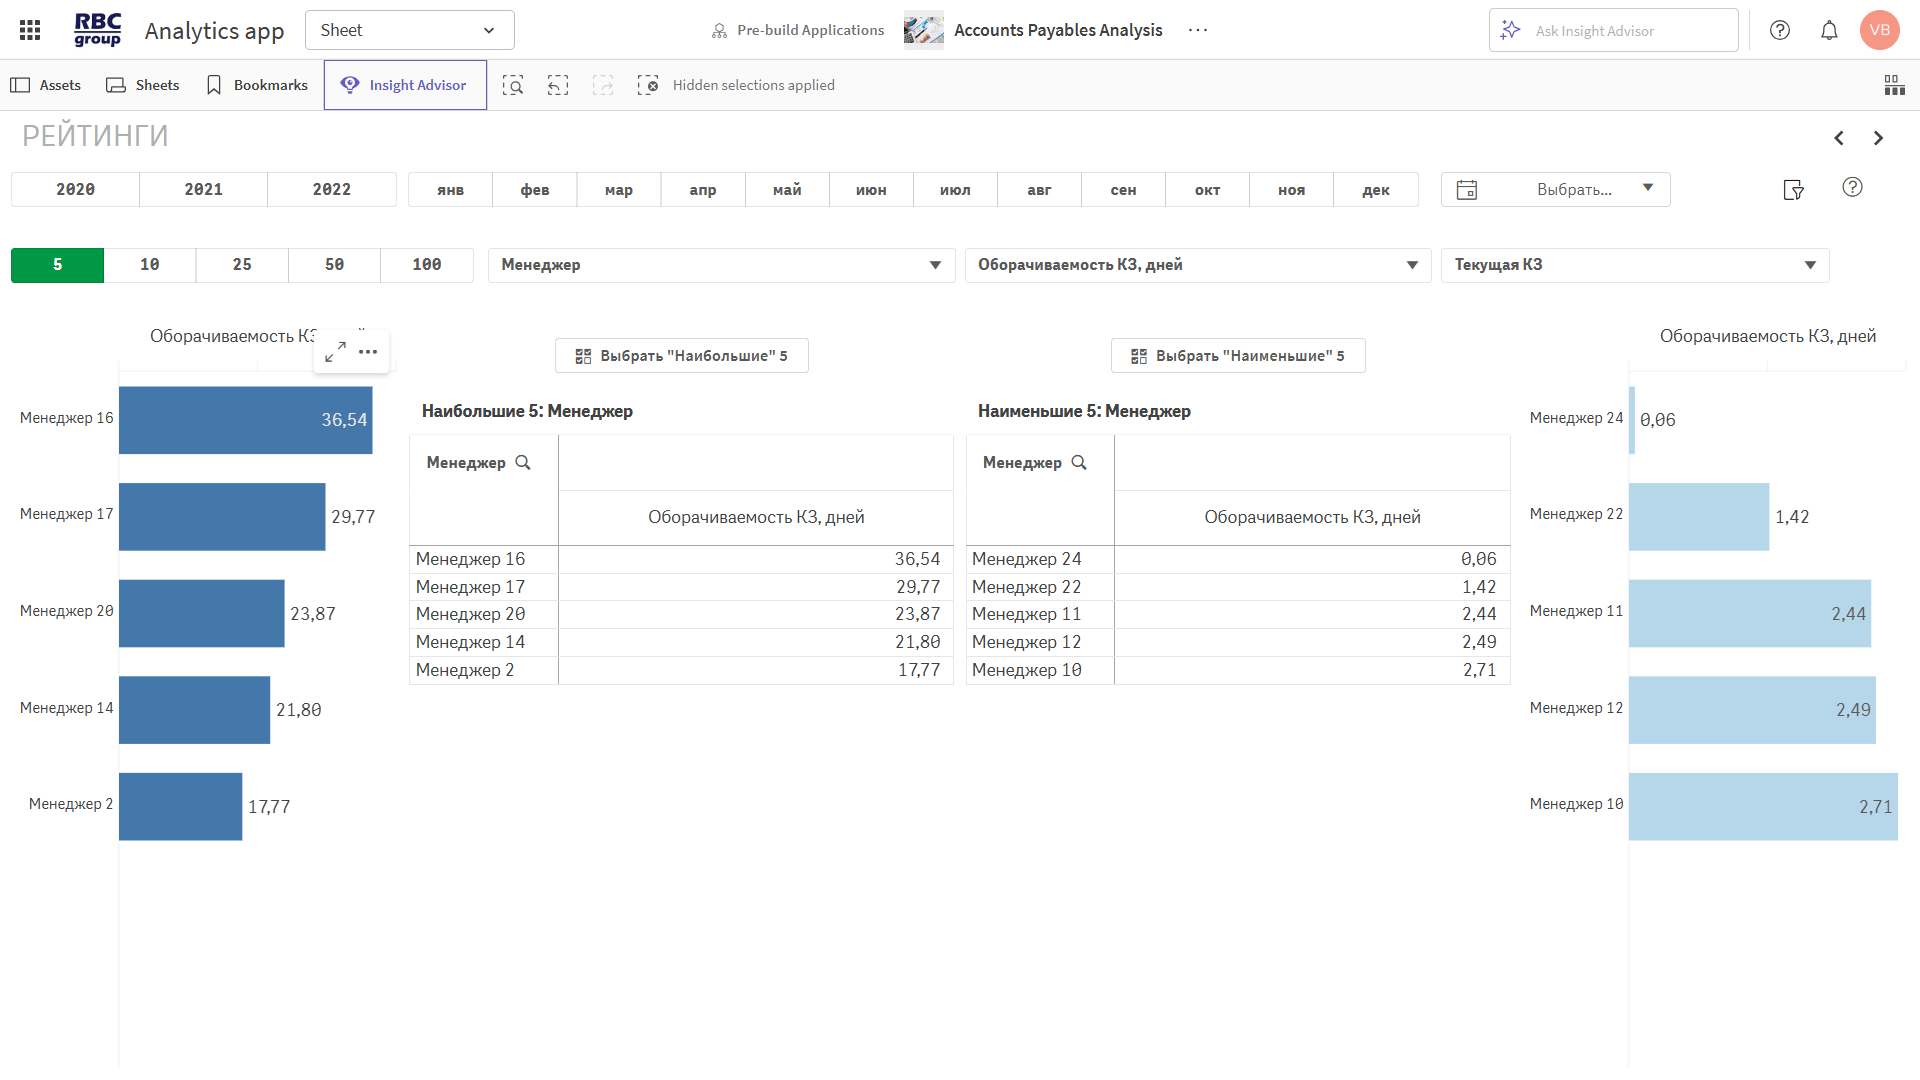
Highlights the strengths and weaknesses of accounts receivable and payable.
◾ Top suppliers by amount owed.
◾ The most and least reliable departments.
◾ Filter by currency, department, manager, contract, and counterparty category.
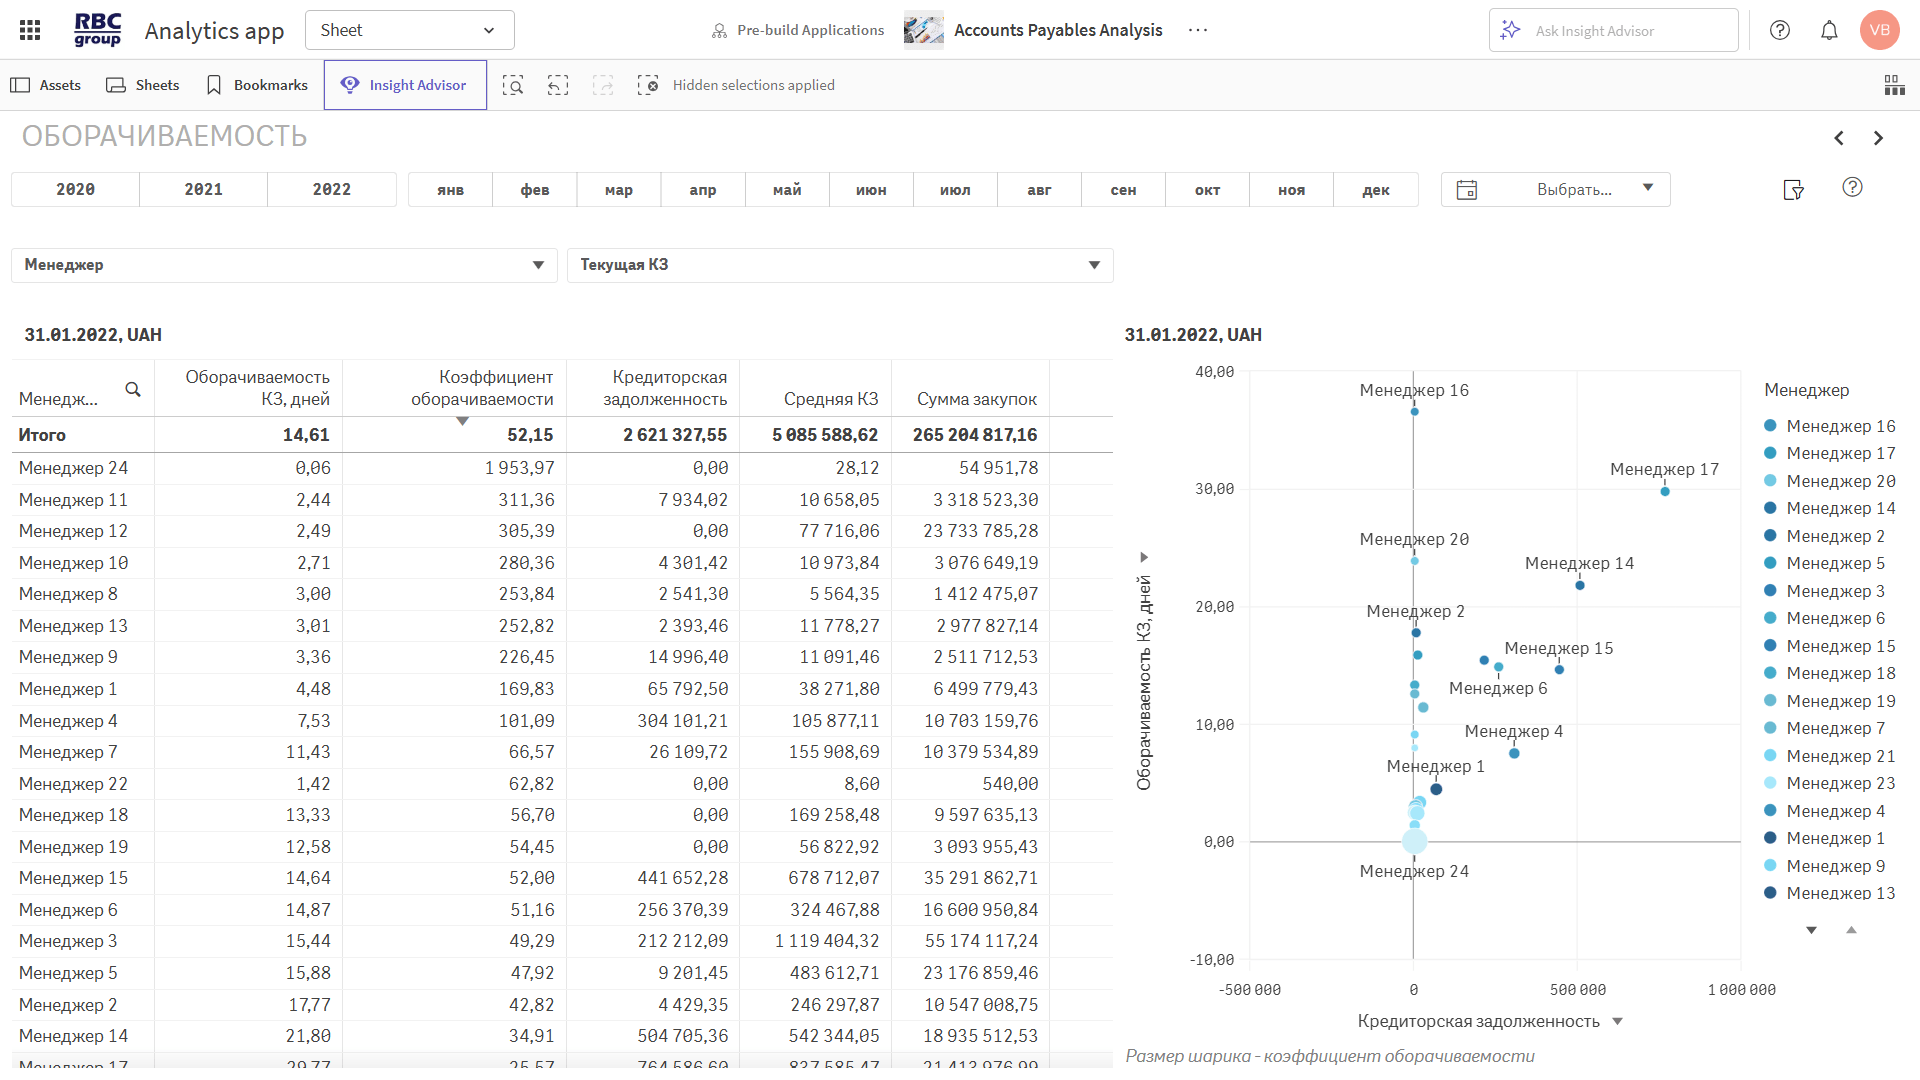
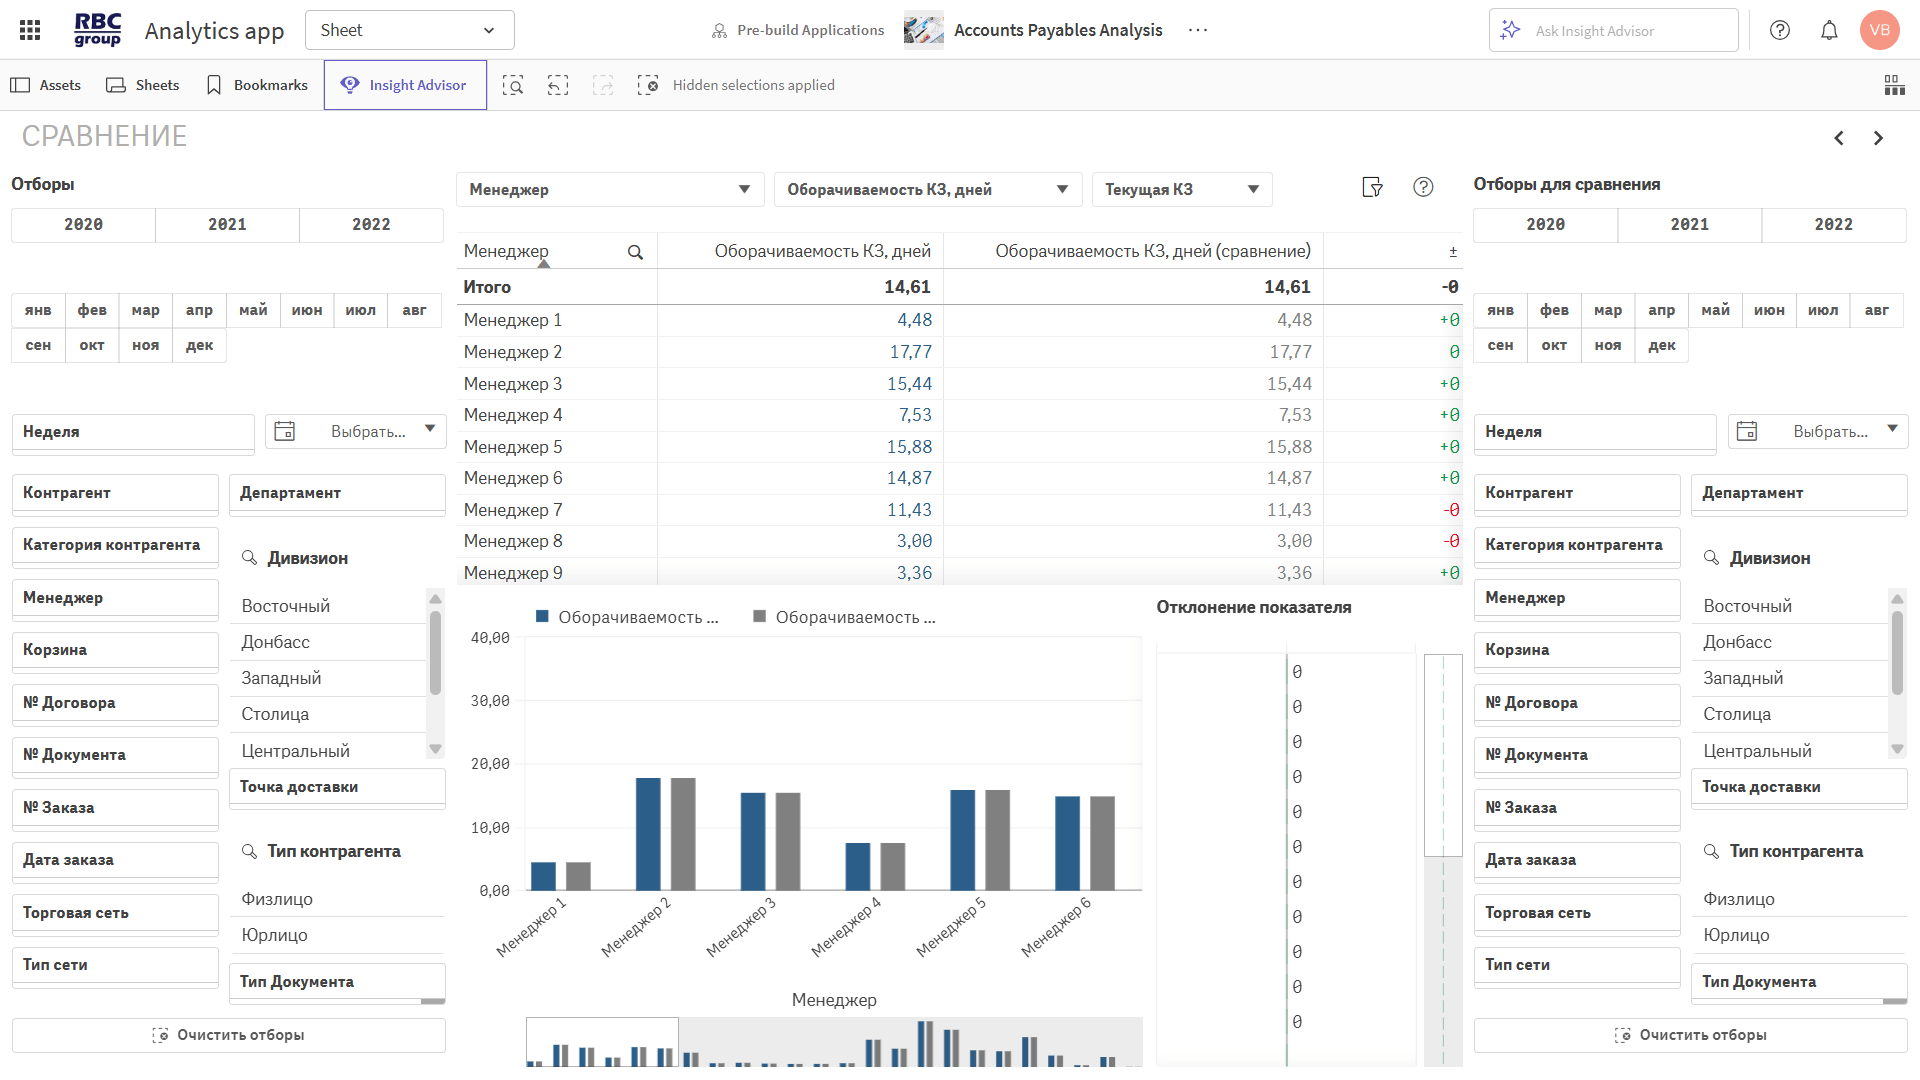
These metrics help you understand how quickly a company settles its liabilities.
◾ Accounts payable turnover ratio — the frequency of payments over a given period.
◾ Turnover in days — a breakdown by department, manager, and counterparty.
Tools for Predictability and Risk Assessment.
◾ Scheduled payments — by date, contract, and supplier.
◾ Restructuring options — impact on the term and amount of accounts payable.
◾ Priorities by aging categories — risk ranking.
◾ What-if analysis — what will happen if a payment is delayed.
We consolidate data from ERP systems, Excel, contracts, and payment schedules. Access analytics from your laptop, tablet, or phone.
All on one screen: how much you owe, to whom, when, and under which contracts. Breakdown down to the document level and convenient filtering.
Analysis of debt and delinquency trends, comparison of metrics on a like-for-like basis, by shopping cart, and by category.
The system displays future obligations, their distribution over time, and the impact of restructuring on the debt burden.
Understand how quickly the company pays its suppliers, and compare performance across departments.
Identify problematic contracts, potential risks of late payments, and the consequences of default (what-if analysis).


RBC Group enhances its clients' competitiveness by implementing modern business analytics, data integration and management, artificial intelligence, and advanced analytics systems.


 26
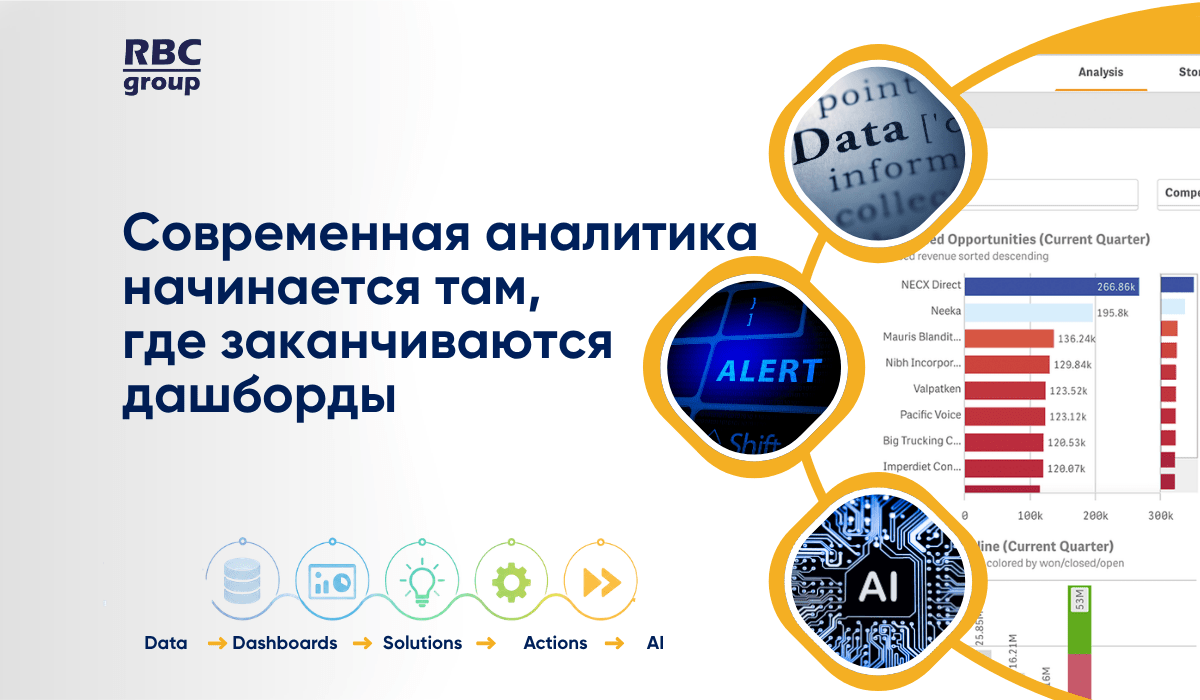
26Современная аналитика — это уже не просто дашборды. Рассказываем, почему бизнесу недостаточно видеть данные и как современные BI-платформы помогают быстрее принимать решения, автоматизировать действия и использовать возможности ИИ.
 35
35Qlik сегодня — это уже не просто BI. На Qlik Community Uzbekistan 2026 участники обсудили будущее аналитики, облачные технологии, интеграцию данных и возможности Agentic AI. Делимся ключевыми выводами и инсайтами мероприятия.
 16
16Почему высокая активность торговых представителей не всегда означает эффективную работу на территории? Рассмотрим ключевые показатели, практические сценарии и подход к управлению торговыми визитами на основе данных.
26Современная аналитика — это уже не просто дашборды. Рассказываем, почему бизнесу недостаточно видеть данные и как современные BI-платформы помогают быстрее принимать решения, автоматизировать действия и использовать возможности ИИ.
35Qlik сегодня — это уже не просто BI. На Qlik Community Uzbekistan 2026 участники обсудили будущее аналитики, облачные технологии, интеграцию данных и возможности Agentic AI. Делимся ключевыми выводами и инсайтами мероприятия.
16Почему высокая активность торговых представителей не всегда означает эффективную работу на территории? Рассмотрим ключевые показатели, практические сценарии и подход к управлению торговыми визитами на основе данных.
Warning: foreach() argument must be of type array|object, false given in /home/rbcgrp/rbcgrp.com/www/wp-content/themes/theme-sp/template/blog.php on line 374

RBC Group offers its clients a software solution that allows them to analyze accounts payable (AP) data across all relevant dimensions: counterparties, vendors, branches, and more. It also makes it easier to analyze accounts payable turnover and track trends in the resolution of overdue payments.
The app allows you to analyze key metrics:
- Total accounts receivable;
- Current accounts receivable;
- Past-due accounts receivable;
- Average accounts receivable;
- Increase in accounts receivable;
- Collection of accounts receivable;
- Turnover.
For your convenience, all these metrics are presented in the form of tables, graphs, and charts, making the information more visual, clear, and easy to understand. Instead of complex, monotonous tables, we offer a clear presentation with appealing visuals and an intuitive structure.
Data sources for analyzing a company’s accounts payable
One of the key advantages of our solution is its versatility. Data can be sourced from various versions and configurations of the 1C accounting system that you use in your company, various ERP systems (enterprise resource planning systems), standard Excel files, and so on.
At the same time, all information obtained from various sources and in different formats will be automatically consolidated within the application, making subsequent analysis of the composition and structure of accounts payable significantly more convenient. And the more data sources are used, the more effective our solution becomes.
Convenient analysis of accounts receivable and accounts payable using pre-built dashboards
The analytics module consists of a set of specially designed dashboard sheets that enable users to perform various analyses of accounts payable.
There are more than ten such dashboards available:
- “Key Metrics”;
- “Ratings”;
- “Outstanding Balances”;
- “Payments”;
- “Turnover”;
- “Trends” and others.
Dashboards enable detailed analysis of an organization’s accounts receivable and accounts payable over time, track changes in these figures, compare them with previous periods, and view changes over various time frames—weekly, monthly, quarterly, and annually.
You can also work with multiple currencies. Currently, three currencies are available: UAH, USD, and EUR. It only takes one click to change the currency—the system will automatically recalculate the data on the dashboard and display the updated information in a matter of seconds.
The steps involved in the analysis and the benefits of our solution
There is a well-established, classic analytical framework which, in summary, consists of three stages:
- Conducting an analysis of accounts receivable, taking into account the amounts owed, their components, and trends. The results of these calculations are typically presented in the form of a graph or table to provide a clearer view of the results and changes over a specific period of time.
- Conducting an analysis of accounts payable, taking into account their amounts, structure, and changes over time. If the proportion of short-term debts to creditors increases, so do the company’s risks.
- Conducting an analysis of accounts receivable and accounts payable to assess their balance. This is an extremely important step, as debts to creditors serve as a source of financing for deferred payments.
Of course, to enter all the data and perform calculations, you could simply create an Excel spreadsheet, add the information and formulas, run the calculations, and then compare data across different periods and so on. But when dealing with large volumes of data, this is a very time-consuming and resource-intensive process.
Our solution automates all stages of analysis and calculations, ensuring maximum efficiency. The RBC Group software provides a comprehensive 360° credit risk analysis with minimal effort.
Analysis of a company’s accounts receivable and accounts payable: who conducts it and for what purposes
Our solution is a truly versatile tool for analyzing accounts payable and accounts receivable. It has been designed and optimized for three main user groups:
- Business owners and executives
Business owners gain real-time visibility into accounts receivable levels and can analyze data through a user-friendly, intuitive consolidated interface, accessible from any device. With the RBC Group solution, they can easily manage intercompany settlements, monitor accounts receivable portfolios, and, if necessary, drill down to specific payments or contracts. Business owners can perform in-depth analysis down to individual business lines, legal entities, departments, managers, and so on. There is no need to use external software solutions or modules for this. All the necessary tools are included in our program and available in a single software package.
- Employees of the sales and finance departments
The RBC Group software enhances the efficiency of accounts receivable and accounts payable management, enabling users to assess the status of accounts receivable and accounts payable both statically and dynamically, view aging reports and their structure, and analyze accounts receivable turnover. Again, all of this is available within a single, user-friendly interface, eliminating the need for third-party solutions.
- IT Director
For IT directors, the RBC Group program enables them to work with data from various systems and sources—quickly and efficiently. The system responds promptly to user requests and can process large volumes of data from disparate sources. Implementation takes minimal time, and there is no need to change your company’s primary accounting system (or systems).
The program’s tools are fully designed for independent use and do not require the user to have any specific knowledge or skills. The interface is minimalist, intuitive, and easy to understand. No extensive training is required to use the program.
Make your accounts payable analysis more efficient, accurate, and straightforward with RBC Group
We developed this solution primarily to help large and medium-sized businesses manage their accounts payable and accounts receivable more effectively by analyzing them at all levels. This is particularly useful when dealing with multiple data sources and accounting systems. The program simplifies the analysis of volumes, structure, and turnover, as well as the composition of accounts receivable and accounts payable, without requiring any internal work on accounting systems or their replacement.
If you’d like to learn more about the technical and functional capabilities of the RBC Group solution, submit a request on our website, and one of our managers will provide you with a free consultation on all your questions. Alternatively, you can request demo access to the program to personally evaluate all its features and benefits, and explore the available dashboards, settings, and visualizations. Our product is designed to make your business more efficient, and we’re ready to prove its effectiveness in practice.

