


Analysis of Accounts Receivable Using BI Azerbaijan
The app helps reduce the risk of cash flow gaps, calculate the inventory turnover ratio, automate the process of monitoring accounts receivable, and assess the reliability of business partners in Azerbaijan


What is the amount of past-due and current accounts receivable?

Which customers have outstanding balances?

Which debtors require special attention?

Where should collection efforts be focused?

What next steps should be prioritized?

How promptly do customers make their payments?

How can you anticipate potential issues with customers who pay late?

How has the debt changed compared to the previous period?

What is the cash flow forecast?

How effective is the company’s lending and collections process?

How much in late fees can you be charged for late payments?

Are there any seasonal trends in payments?
a BI platform


This preconfigured solution enables you to perform KPI analysis, plan-vs-actual analysis, dynamic analysis, percentage analysis, multidimensional analysis, comparative analysis, ranking analysis, LFL analysis, and transactional analysis of accounts receivable for a company or group of companies; analyze accounts receivable from all angles—by aging, turnover, and payments—and generate rankings of the top performers and underperformers
"Accounts Receivable Analysis" on the Power BI platform is a preconfigured solution that enables KPI analysis, plan-vs-actual analysis, dynamic analysis, percentage analysis, multidimensional analysis, comparative analysis, ranking analysis, LFL analysis, and transactional analysis of accounts receivable for a company or group of companies.
The solution enables a 360-degree analysis of accounts receivable across all available dimensions—by aging groups, turnover rates, and payments—and allows you to generate rankings of the top performers and underperformers.
Shows the total amount of customers' liabilities to the company.
◾ Total accounts receivable (AR) — the aggregate amount of all outstanding invoices.
◾ Current AR — payments that are due but not yet past due.
◾ Past-due AR (PDA) — payments that are past due, which increase credit risk.
◾ % PAA — the proportion of overdue payments in total accounts receivable.
It analyzes how consistently customers make their payments.
◾ DSO (days sales outstanding) — the lower the figure, the faster the cash flow.
◾ Amount of on-time payments — funds received on time.
◾ Amount of past-due payments — affects liquidity.
◾ % of on-time payments — level of payment discipline.
Measures the speed at which receivables are converted into cash.
◾ Accounts receivable turnover ratio — the number of times accounts receivable are renewed during a given period.
◾ Days sales outstanding — the average "lifespan" of accounts receivable
A tool for estimating lost profits.
◾ Total late fees — potential compensation.
◾ Impact of late fees on cash flow — impact on liquidity.
Allows you to anticipate potential revenue issues in advance.
◾ Projected revenue — expected payments in the near future.
◾ Customer debt analysis — identifying high-risk customers.
◾ Scenario analysis — modeling different possible outcomes.

In just 30 minutes, learn how to get a complete picture of your accounts receivable, identify risks, and establish control over cash inflows.
We’ll show you a ready-to-use analytical solution with minimal implementation requirements.
This BI solution helps you monitor and manage receivables in real time.
You always know:
◾ who is behind on payments
◾ which accounts require attention
◾ how the receivables structure is changing
Analytical models help predict payment due dates and identify customers at high risk of default.
This allows you to:
◾ plan cash flows
◾ minimize cash flow gaps
System:
◾ Automatically updates data
◾ Analyzes accounts receivable
◾ Generates reports with a single click
Result:
Less routine work, more time for strategy.
Interactive dashboards let you analyze outstanding balances by various categories:
◾ customers
◾ regions
◾ managers
◾ payment terms
All in one interface.
Information is available in real time from any device:
◾ computer
◾ tablet
◾ smartphone
Work from the office, at home, or while traveling—always with up-to-date data.


RBC Group enhances its clients' competitiveness by implementing modern business analytics, data integration and management, artificial intelligence, and advanced analytics systems.


 26
26Современная аналитика — это уже не просто дашборды. Рассказываем, почему бизнесу недостаточно видеть данные и как современные BI-платформы помогают быстрее принимать решения, автоматизировать действия и использовать возможности ИИ.
 35
35Qlik сегодня — это уже не просто BI. На Qlik Community Uzbekistan 2026 участники обсудили будущее аналитики, облачные технологии, интеграцию данных и возможности Agentic AI. Делимся ключевыми выводами и инсайтами мероприятия.
 16
16Почему высокая активность торговых представителей не всегда означает эффективную работу на территории? Рассмотрим ключевые показатели, практические сценарии и подход к управлению торговыми визитами на основе данных.
26Современная аналитика — это уже не просто дашборды. Рассказываем, почему бизнесу недостаточно видеть данные и как современные BI-платформы помогают быстрее принимать решения, автоматизировать действия и использовать возможности ИИ.
35Qlik сегодня — это уже не просто BI. На Qlik Community Uzbekistan 2026 участники обсудили будущее аналитики, облачные технологии, интеграцию данных и возможности Agentic AI. Делимся ключевыми выводами и инсайтами мероприятия.
16Почему высокая активность торговых представителей не всегда означает эффективную работу на территории? Рассмотрим ключевые показатели, практические сценарии и подход к управлению торговыми визитами на основе данных.
Warning: foreach() argument must be of type array|object, false given in /home/rbcgrp/rbcgrp.com/www/wp-content/themes/theme-sp/template/blog.php on line 374

Analysis of Accounts Receivable Using BI
A comprehensive analysis of accounts receivable involves numerous evaluation criteria. Collecting, organizing, and comparing data, as well as presenting the results in a format that is easy to analyze, requires a significant amount of effort. If a more detailed examination of specific values or transactions is needed, one must return to the initial stage of the analysis and re-collect and process the data.
Business Intelligence applications provide full, unhindered access to the information needed for a comprehensive analysis of an organization’s accounts receivable. You can work with this data immediately after launching the application. The program automatically collects and structures the information and calculates key metrics, allowing you to assess the current situation and compare it with previous periods. Users can quickly change the analysis criteria, examining metrics broken down by individual managers, counterparties, sales channels, departments, or shopping carts.
What are the capabilities of analyzing accounts receivable using BI?
The main difference between Business Intelligence software and other methods of data analysis is its ability to provide the most comprehensive view of the data landscape. When analyzing a company’s accounts receivable, the process involves not only key performance indicators but also the full range of data that helps assess the current situation in the most comprehensive way possible. Users have access to several working tabs; by switching between them, you can access different types of analytics.
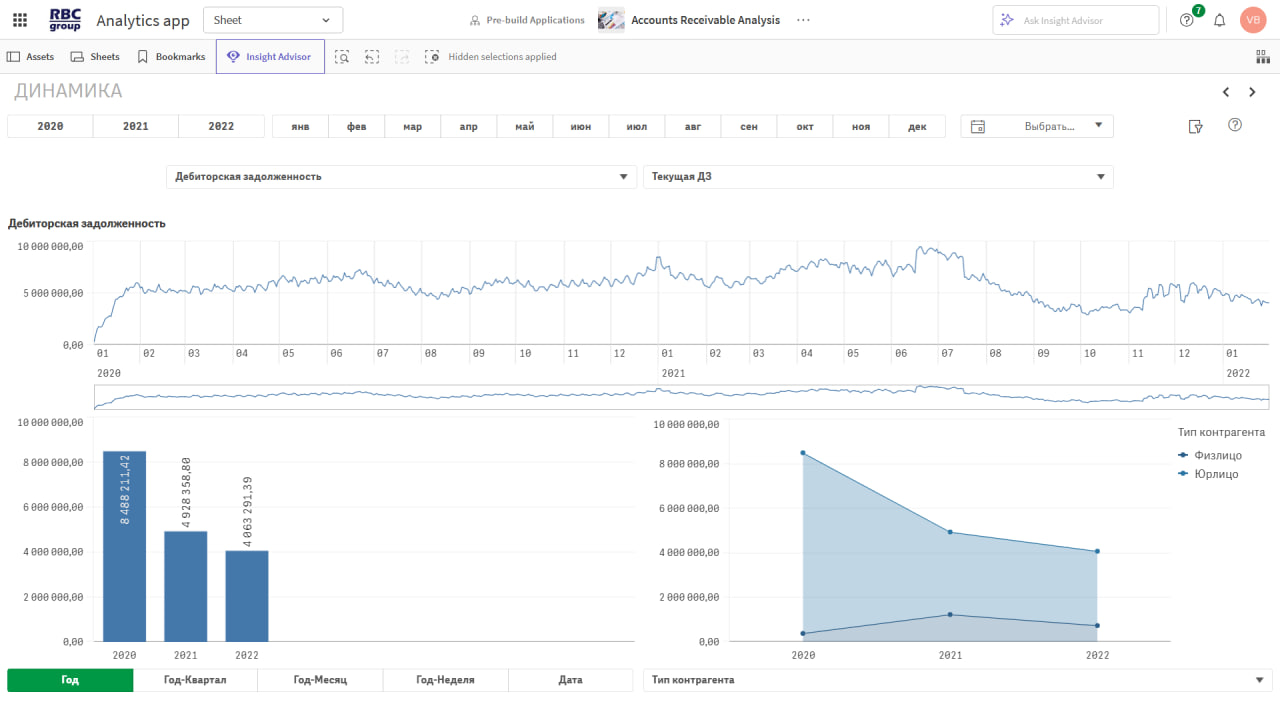
Dashboard with key metrics
Allows you to monitor changes in key values:
- various types of accounts receivable;
- revenue;
- payments;
- accounts receivable turnover ratio.
In addition to absolute values, the dashboard displays trends in individual metrics relative to the previous period (week, month, quarter) or last year’s figures for a specified date. The dashboard also allows you to track changes in the debt ratio by basket.
Ranking
These are generated based on absolute and relative payment amounts, trends, and ratios for the period under review. They are compiled by manager, counterparty, customer group, or sales unit. Users can generate rankings based on the most significant indicators, such as total debt, accounts receivable turnover, revenue, the percentage of overdue payments, and others. Generating a ranking allows you to quickly identify leaders and underperformers, set goals, and make decisions.
Statement of Mutual Settlements
Provides comprehensive analytics showing the results of accounts receivable management broken down by manager, sales channel, region, and various types of counterparties. The report includes information on revenue, expenses, and the amount of accounts receivable, broken down by due date and turnover rate. The data can be analyzed by a specific year, month, or any custom period.
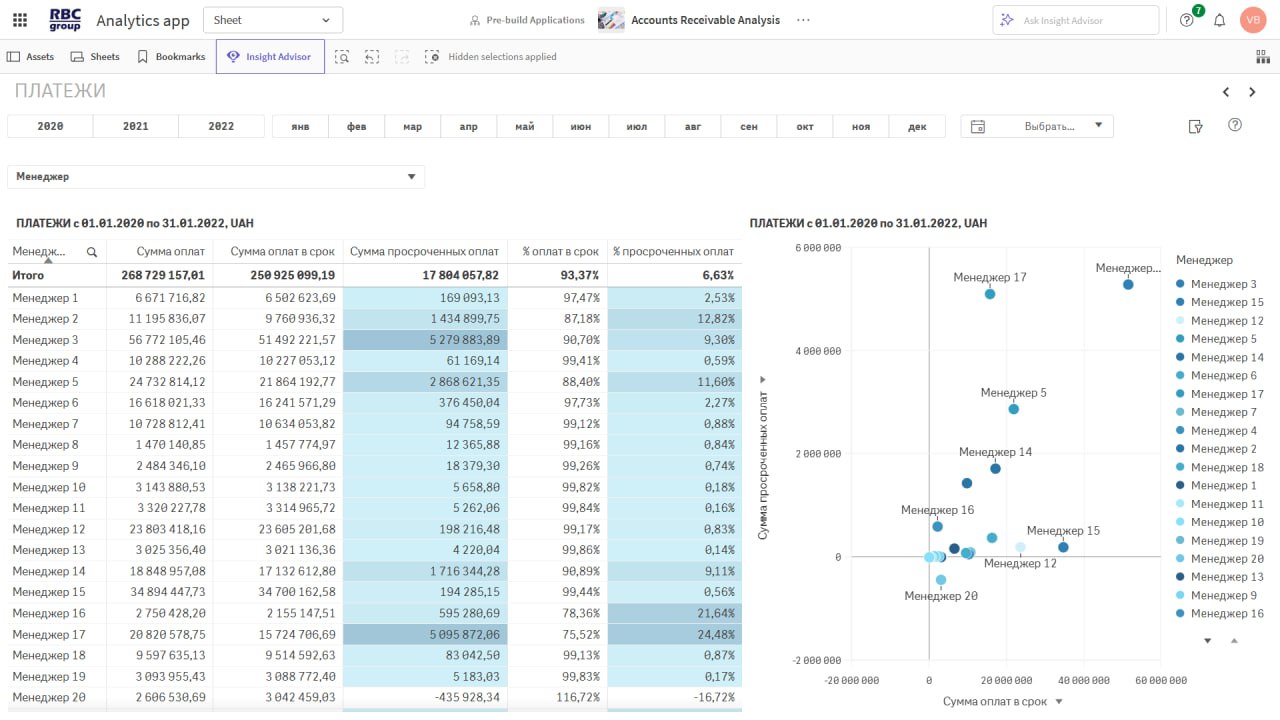
Payment Analysis
It categorizes payments as on-time or overdue and determines their share of the total amount. Payments can be analyzed by manager, counterparty, counterparty type and group, sales channel, geographic region, or overdue category. Assessing the status of accounts receivable will help managers identify the most strategically important partners, prioritize sales channels, and recognize high-performing managers.
Payment Scheduling
This section allows you to forecast debt repayment amounts broken down by manager, retail chain, sales channel, product basket, region, and counterparty as of a specific date. In addition, the program generates a debt restructuring plan to assist with debt repayment.
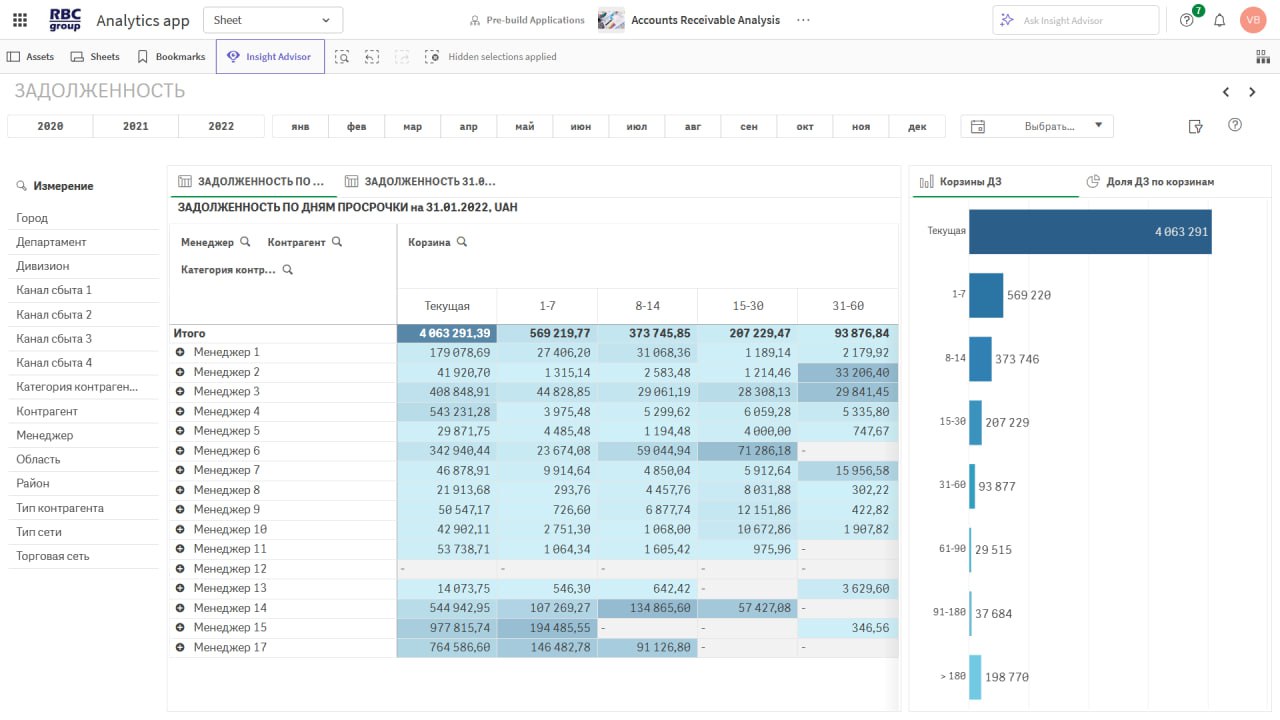
Arrears by number of days overdue
It can be analyzed by individual departments, divisions, managers, counterparties, retail chains, or regions. You can also segment the data into several groups based on the length of payment delays.
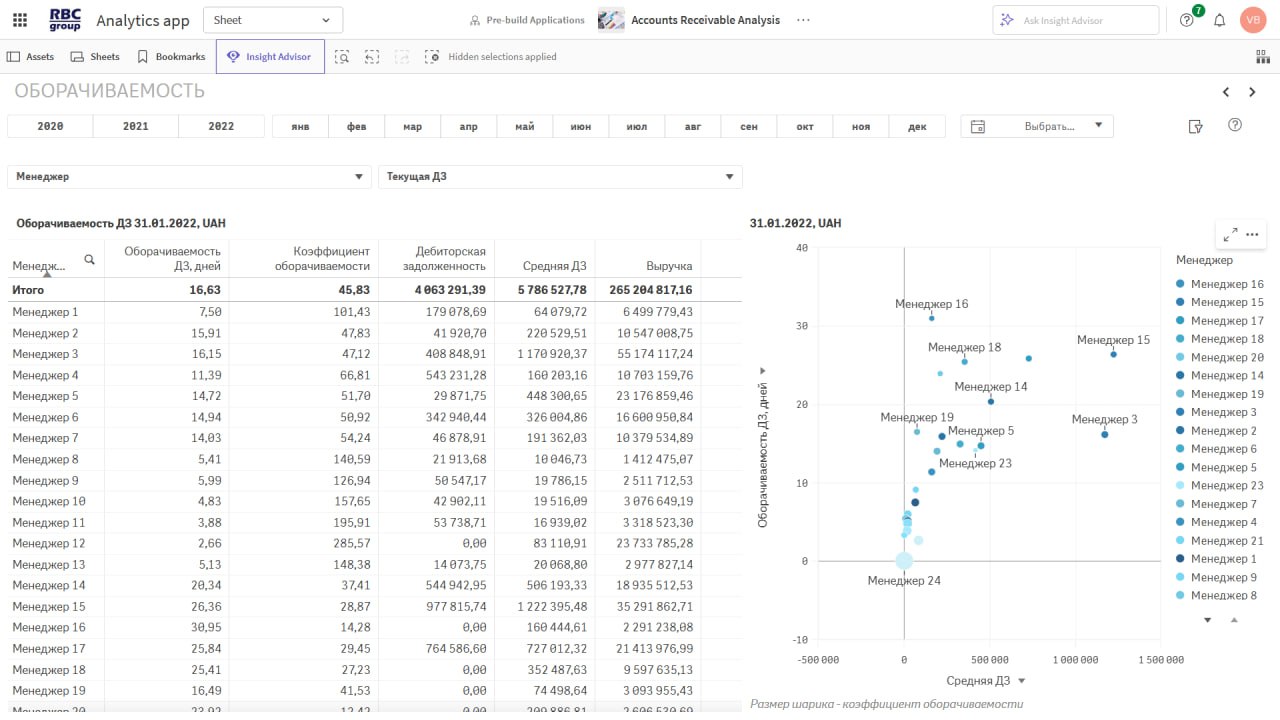
Turnover
It helps assess the performance of managers, the effectiveness of sales channels, and the speed of accounts receivable turnover by region and department. Data can be analyzed by current, total, and past-due receivables, as well as total receivables adjusted for prepayments. The results are displayed in tabular form as well as using a scatter plot.
Trends in key indicators
It allows you to compare data for a specific day, week, quarter, or year with information from previous periods. Here, you can analyze how accounts receivable have changed in relation to metrics such as revenue, the amount of timely payments, the number of counterparties, and other indicators. The analysis can be performed in both domestic and foreign currencies, which helps offset the impact of inflation.
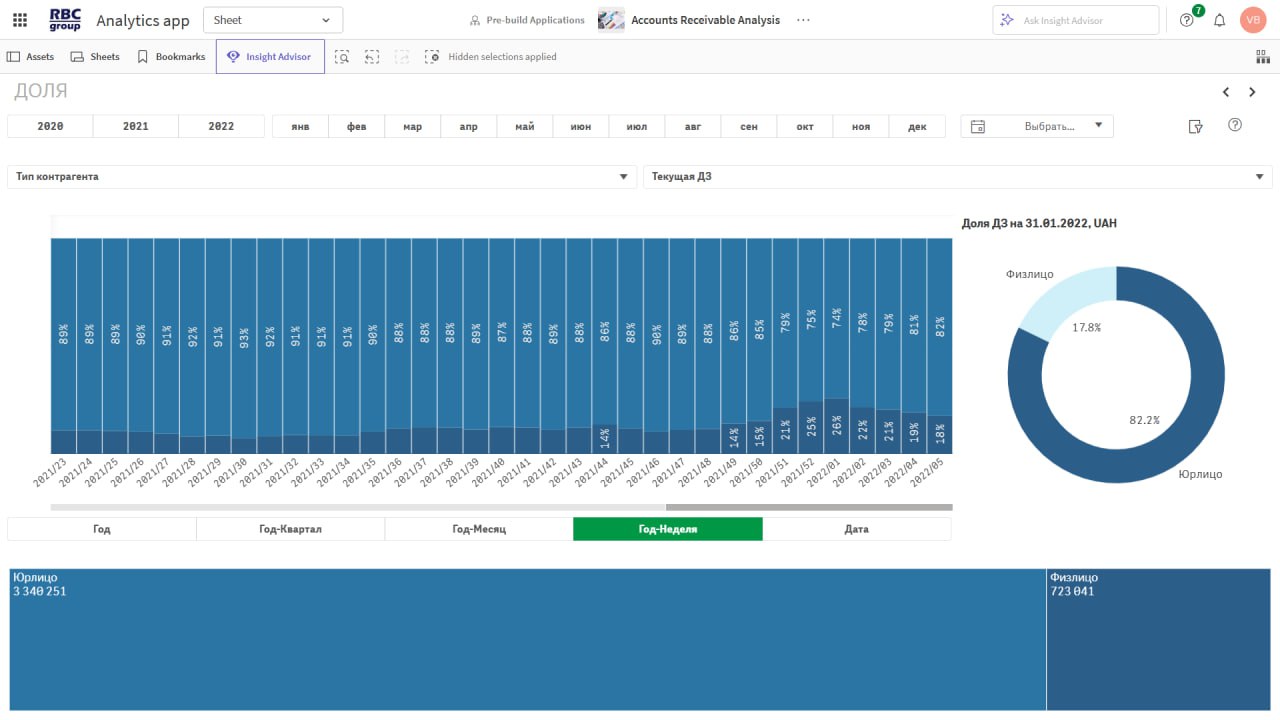
Analysis of the debt structure
Displays the proportion of each type of delinquency, which can be analyzed by counterparty type and category, product mix, individual sales channels, business units, managers, or geographic regions.
Analysis of Random Baskets
It allows you to classify receivables based on a customizable delinquency period and analyze them by individual managers, sales channels, regions, and counterparty types. Users can select data using three custom filters and manage their hierarchy by dragging and dropping the selected categories. Analysis of accounts receivable composition can be performed in both local and foreign currencies.
Counterparty Reliability Rating
It helps identify priority partners for future collaboration and pinpoint the least reliable ones, which influences the development of future relationships.
Business Intelligence is a tool for enhancing a business’s competitiveness. By properly managing financial transactions with counterparties, you will ensure your company’s financial stability and investment appeal.
Key Benefits of BI in Intercompany Settlement Analysis
The analysis of accounts receivable using Business Intelligence is distinguished by:
- flexible capabilities – the system handles large volumes of data, reorganizing it according to user requests. You can structure the information to meet your analytical needs, assessing the quality of relationships with counterparties, as well as the performance of individual managers, departments, or business units.
- Efficiency – data grouping, calculation of metrics, and the creation of graphs and charts are performed without user intervention. The user’s only task is to define the analysis criteria—selecting dates and a list of metrics.
- Comprehensive nature – the entire set of analytical procedures is carried out within a single application. Business Intelligence enables in-depth analysis, allowing you not only to identify general patterns and trends but also to determine their essence and root causes.
A key advantage of the system is its simple, intuitive interface, as well as convenient access to analytics from various types of devices. Generating reports on the BI platform does not require the involvement of IT specialists.

