


Analysis of Azerbaijan's Balance Sheet
Balance Sheet Analysis is part of the comprehensive "Financial Analysis" solution. This solution enables the automatic consolidation of financial statements across a group of companies. Companies within the group may use different accounting systems and apply unique accounting policies. The solution includes predefined analysis methodologies and consolidation rules.


How has the structure of assets and liabilities changed compared to the beginning of the year and the previous period?

Which balance sheet items account for the largest share of the structure of assets and liabilities?

What are the sources of capital formation, and how has its structure changed?

Where are short-term or long-term liabilities increasing, and how does this affect sustainability?

To what extent does the balance sheet structure align with the company's targets?

How is the ratio of current to non-current assets changing?
Which financial institutions or organizations have deviations from liquidity or debt ratios?
Where are the inefficient or excess assets concentrated?

To what extent do current assets cover liabilities?

How have accounts receivable and accounts payable changed?

What changes have occurred in the capital structure (authorized capital, additional paid-in capital, retained earnings)?

Where have significant changes in balance sheet items been identified that require attention?
a BI platform


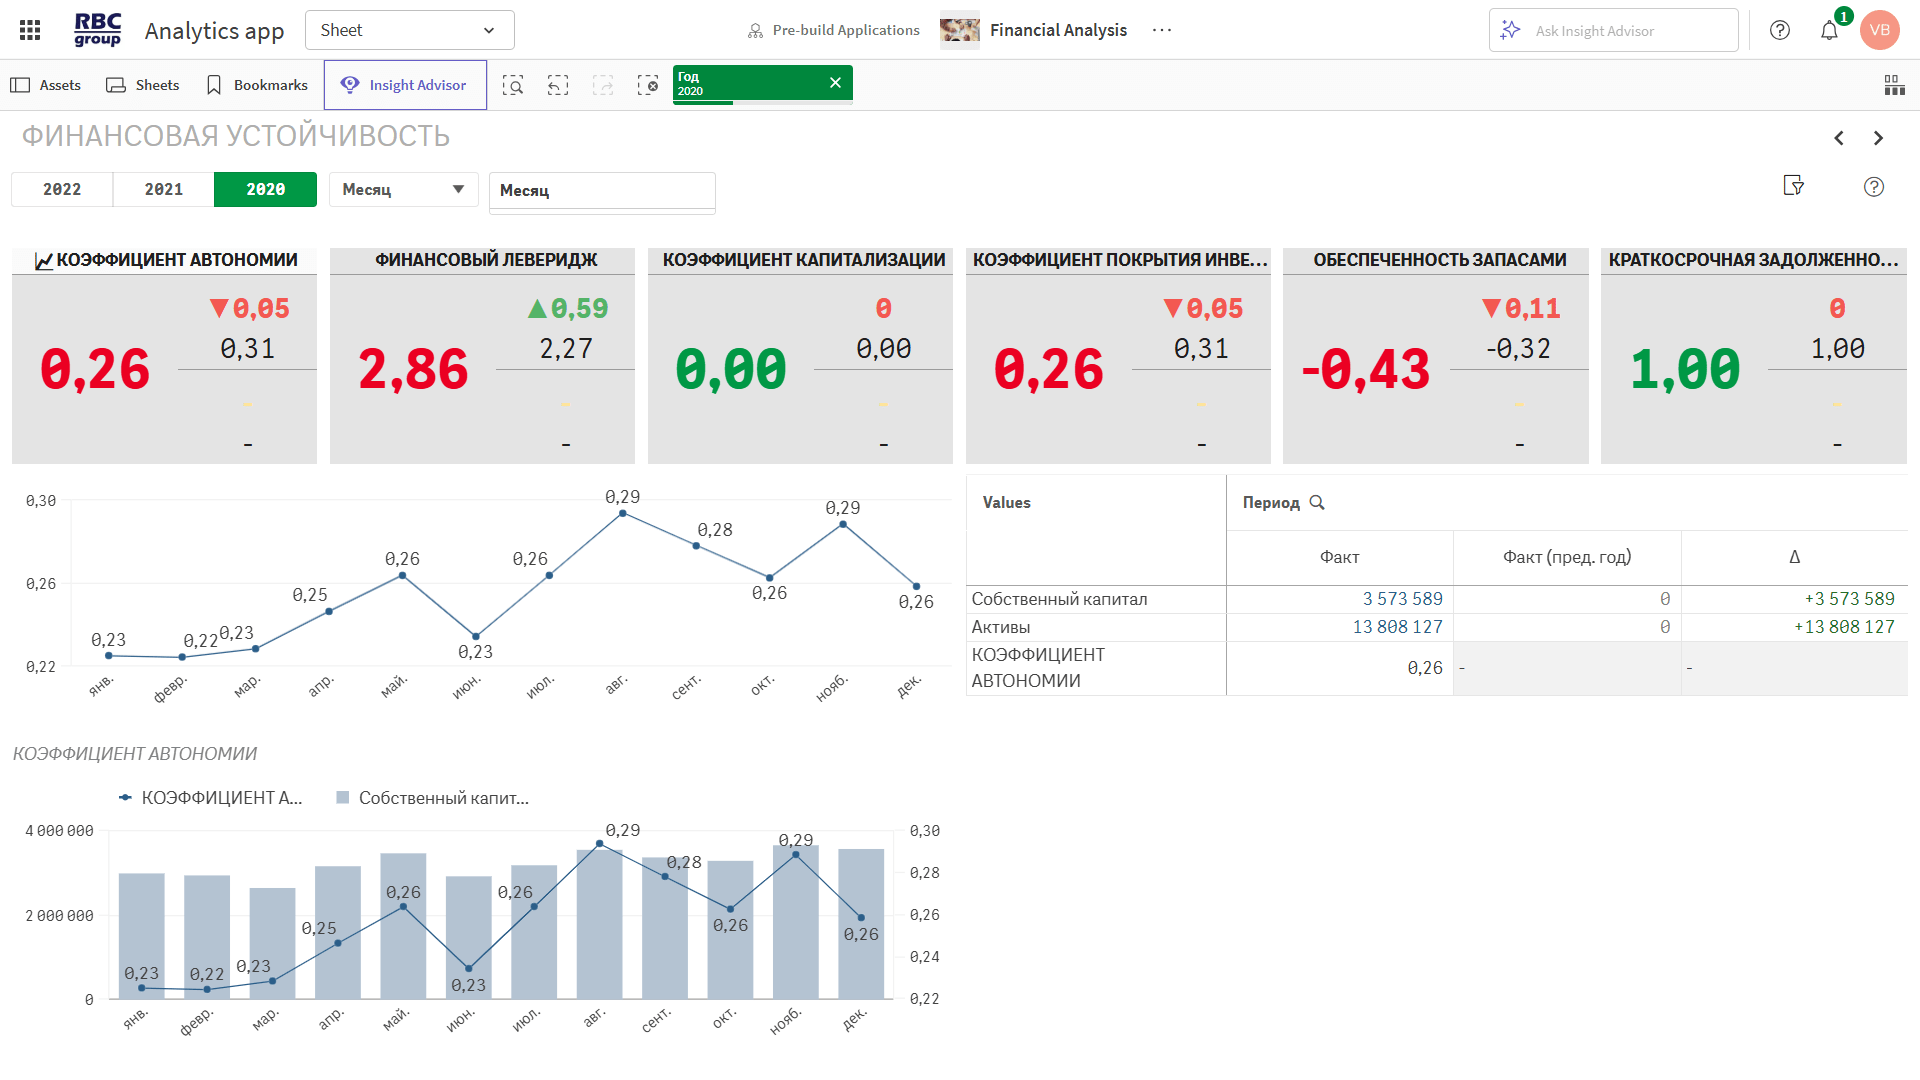
"Balance Sheet Analysis" enables the consolidation of balance sheets across a group of companies and their subsequent analysis.
The solution is designed to provide company executives and specialists with tools for quick and convenient analysis across all dimensions: organization, responsibility centers, departments, and line items.
"Balance Sheet Analysis" enables users to consolidate the balance sheets of a group of companies and perform a detailed analysis of them.
The solution is designed for executives and specialists, providing them with a convenient and effective tool for analyzing data across various dimensions: organization, responsibility centers, departments, and individual line items.
Shows the distribution of resources and their sources.
◾ Non-current and current assets
◾ Current and long-term liabilities
◾ Sources of capital
Allows you to track changes in the balance sheet structure over time and by organization.
◾ Comparison with the beginning of the year and the same period last year
◾ Absolute and relative deviations
◾ Analysis by Central Financial District and organization
These ratios reflect liquidity, financial independence, and the effectiveness of asset management.
◾ Current ratio
◾ Financial independence ratio
◾ Equity-to-liabilities ratio
◾ Asset turnover
Highlights key items and their contribution to the balance sheet structure.
◾ ABC analysis of assets and liabilities by volume
◾ Structural analysis by asset class and source of capital
Provides a clear overview of trends and variances.
◾ Quarterly and annual performance trends
◾ Heat maps of variances
◾ Visualization in charts and tables, with breakdowns down to individual balance sheet items

In just 30 minutes, you’ll learn how BI helps you track your balance sheet structure, monitor liquidity and financial stability ratios, identify risks, and make informed decisions.
We’ll demonstrate a ready-to-use analytical solution with minimal implementation requirements.
Key metrics for assets, liabilities, and equity are consolidated into a single dashboard. Users can drill down to individual line items and compare data across periods and structures.
Result: increased transparency and manageability of the balance sheet structure.
Ratios are calculated automatically, deviations are highlighted, and risks are identified in advance. You can see the actual situation for each organization or Central Federal District.
Result: control of debt burden and timely response to changes.
All changes in assets, liabilities, and capital structure are tracked by period. The interface allows you to analyze trends, ratios, and structure all in a single window.
Result: informed management of assets, capital, and liabilities.


RBC Group enhances its clients' competitiveness by implementing modern business analytics, data integration and management, artificial intelligence, and advanced analytics systems.


 26
26Современная аналитика — это уже не просто дашборды. Рассказываем, почему бизнесу недостаточно видеть данные и как современные BI-платформы помогают быстрее принимать решения, автоматизировать действия и использовать возможности ИИ.
 35
35Qlik сегодня — это уже не просто BI. На Qlik Community Uzbekistan 2026 участники обсудили будущее аналитики, облачные технологии, интеграцию данных и возможности Agentic AI. Делимся ключевыми выводами и инсайтами мероприятия.
 16
16Почему высокая активность торговых представителей не всегда означает эффективную работу на территории? Рассмотрим ключевые показатели, практические сценарии и подход к управлению торговыми визитами на основе данных.
26Современная аналитика — это уже не просто дашборды. Рассказываем, почему бизнесу недостаточно видеть данные и как современные BI-платформы помогают быстрее принимать решения, автоматизировать действия и использовать возможности ИИ.
35Qlik сегодня — это уже не просто BI. На Qlik Community Uzbekistan 2026 участники обсудили будущее аналитики, облачные технологии, интеграцию данных и возможности Agentic AI. Делимся ключевыми выводами и инсайтами мероприятия.
16Почему высокая активность торговых представителей не всегда означает эффективную работу на территории? Рассмотрим ключевые показатели, практические сценарии и подход к управлению торговыми визитами на основе данных.
Warning: foreach() argument must be of type array|object, false given in /home/rbcgrp/rbcgrp.com/www/wp-content/themes/theme-sp/template/blog.php on line 374

Balance Sheet Analysis Using Business Intelligence Systems
The results of an analysis of a company’s balance sheet provide a wealth of data to support decision-making. The reliability and accessibility of such information are directly linked to the quality of the company’s financial management and strategic governance. The main challenges faced by analysts in the past were:
- The significant time required to generate reports and calculate metrics made real-time monitoring impossible. The need to present data in an easily understandable graphical format required a great deal of manual labor.
- Inaccurate information—during the process of repeated modifications, data could be duplicated or distorted. Identifying discrepancies required significant time and negatively impacted the results of the analysis and the effectiveness of decision-making.
- Lack of flexibility—reports were not interactive. When it was necessary to drill down into specific balance sheet items, one had to return to the tables, search for the necessary data, perform calculations, and identify relationships.
When it is critical to have a single source of truth and instant access to a wide range of data, you should turn to Business Intelligence software. By processing large volumes of information, the platform provides a wide range of users with access to various types of reports. Business Intelligence software automatically collects data for balance sheet analysis and presents it in the most visually intuitive format. This helps managers identify current trends, make forecasts, and form hypotheses.
Implementing the system improves the quality and speed of decision-making. The automated approach allows you to examine information through graphs and charts that are generated effortlessly in real time. This enables you to analyze data more quickly and make decisions promptly, which is particularly important in today’s rapidly changing environment. Using Business Intelligence will reduce the costs of generating and maintaining enterprise-level reports and enable managers to be more effective without extra effort, contributing to increased profitability and the overall value of the business.
Types of Balance Sheet Analysis
Analyzing a company’s balance sheet using Business Intelligence systems helps identify key trends in the company’s financial health. The shift from presenting data in tabular form to visualizing performance results through graphs and charts allows for a quick overall assessment of the business and, if necessary, a deeper investigation into the causes of specific trends. The software enables vertical, horizontal, and ratio analysis of the balance sheet, eliminating the need for manual calculations. Data is analyzed directly within the application interface, and the final results can be exported for use in presentations and reports.
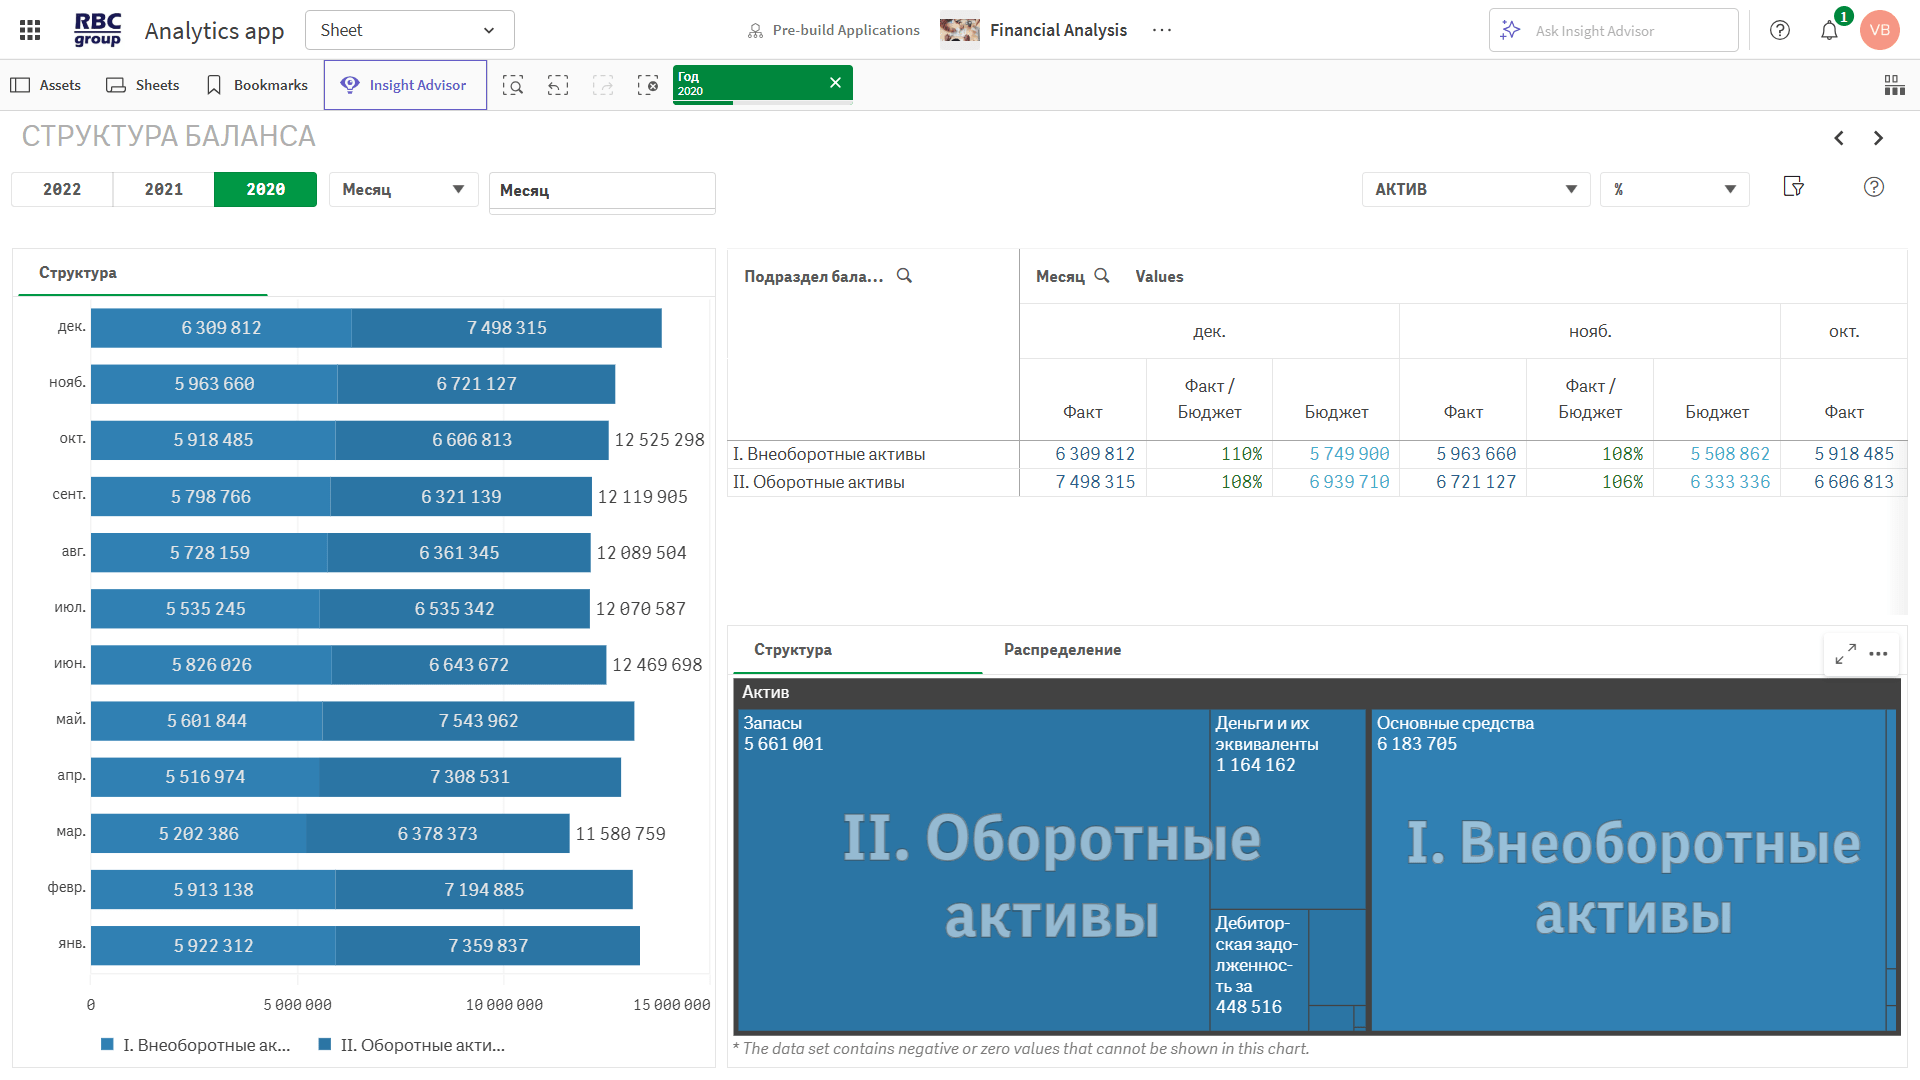
Vertical Analysis of the Balance Sheet
Vertical analysis is also known as balance sheet structure analysis. It shows the proportion of a specific item in the total, whether on the asset or liability side. The resulting data is analyzed over time, which allows for the identification of changes occurring within the business. The list of items whose proportions need to be examined is determined by the purpose of the analysis. For example, to assess financial stability, it makes sense to examine changes in the proportions of accounts receivable and accounts payable, current and long-term liabilities, fixed assets, and cash assets.
Vertical analysis can serve as a tool for comparing your business with other industry indicators. This is facilitated by standardizing indicators through the use of relative values.
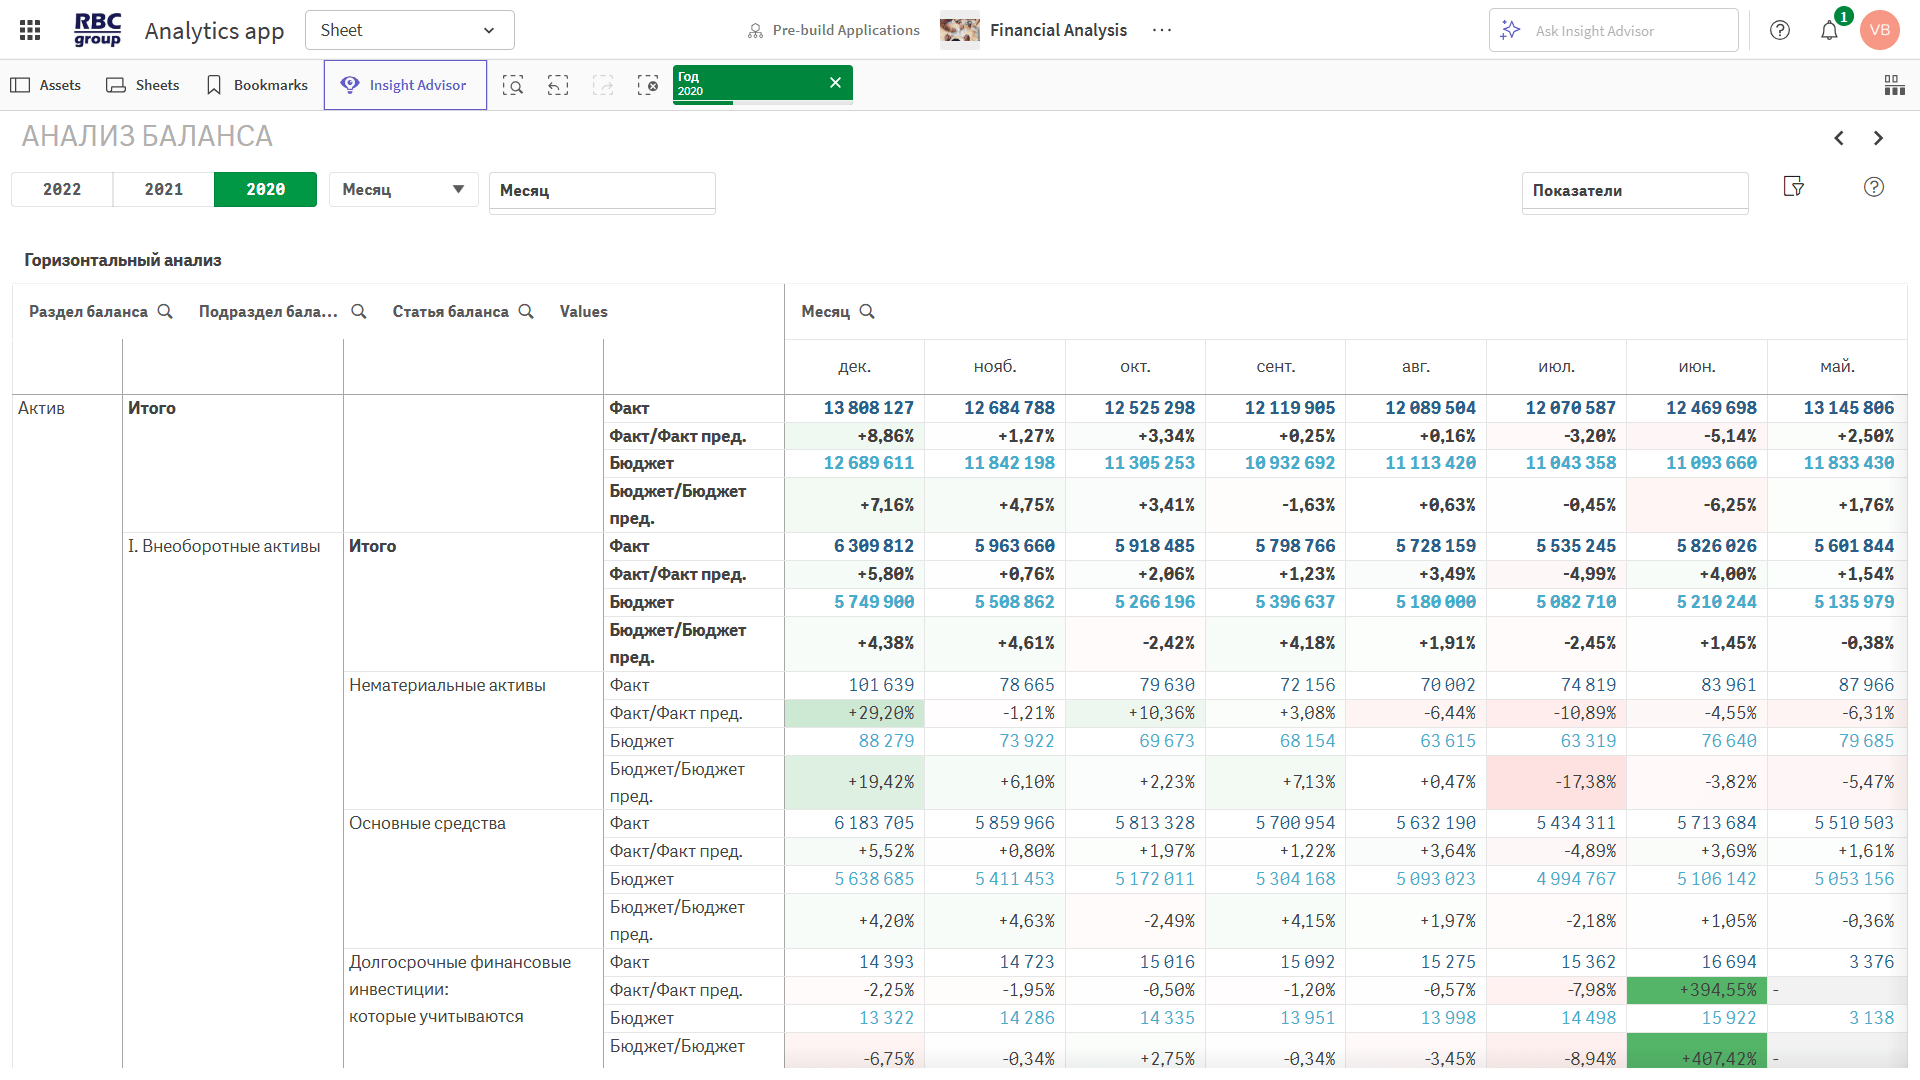
Horizontal Balance Sheet Analysis
The purpose of horizontal analysis is to examine changes in individual balance sheet items over time. To this end, current figures are compared with those from previous periods. Horizontal balance sheet analysis can be described as trend analysis—it helps identify trends in business development. Key metrics that require constant monitoring include accounts receivable and accounts payable, capital structure, cash, inventory, and reserves. This list can be supplemented with any indicators relevant to the current analysis. Trend analysis demonstrates the pace and quality of the company’s growth, as well as the effectiveness of management.
At first glance, vertical and horizontal balance sheet analysis appear to be fundamentally different approaches. However, they do have a point of intersection. Examining indicators in terms of structure and dynamics helps identify growth areas that are not immediately obvious and that other types of analysis do not reveal as clearly.
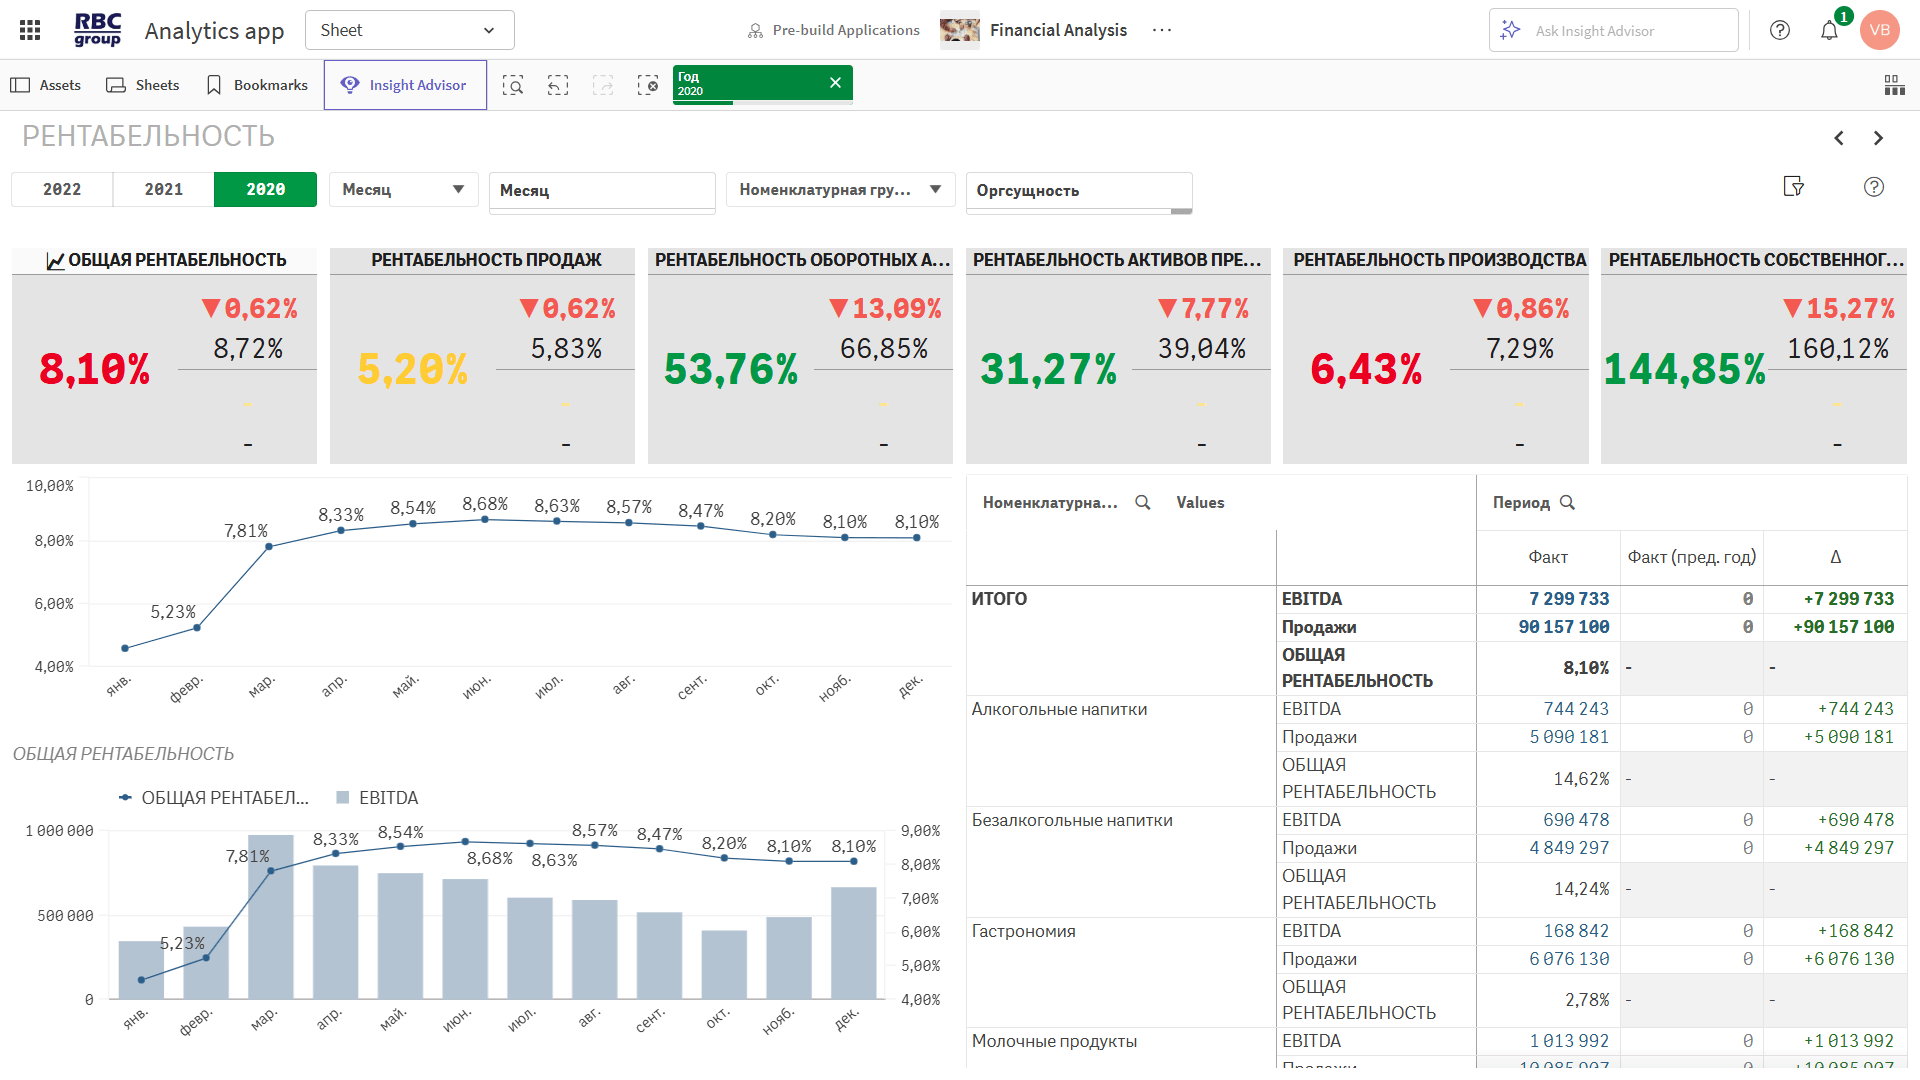
Ratio Analysis of the Balance Sheet
Vertical and horizontal analysis provide insight into changes that have occurred within a company and enable forecasting, as they compare current results with those of previous periods. Balance sheet ratio analysis provides information about a company’s current financial position, its ability to meet its obligations, and its stability. It helps assess the company’s operational efficiency and financial condition at a given point in time, as well as make short-term forecasts. There are dozens of ratios used in the balance sheet analysis process. Let’s group the main ones:
- Liquidity analysis – the ratio of a company’s readily convertible assets to its liabilities. It demonstrates the extent to which a company is prepared to settle accounts with its counterparties in a timely manner. Key indicators include quick ratio, current ratio, and cash adequacy ratio. An increase in liquidity is viewed as a positive factor, indicating the company’s financial independence. However, significantly exceeding the recommended parameters may indicate inefficient resource allocation—the “freezing” of funds in highly liquid assets to the detriment of operational and financial activities.
- Profitability – a group of indicators demonstrating the efficiency of resource utilization. Their growth signals successful management of the enterprise and an improvement in its performance. Ratios of return on assets, liabilities, investments, sales, equity, and others allow for the identification of the organization’s most successful areas of activity. To provide an objective assessment of management effectiveness, it is necessary to compare this KPI with historical data and industry benchmarks.
- Financial stability indicators demonstrate the extent to which an organization’s operations are independent of external sources of financing. Such data serve as a valuable resource for short-term analysis over the near term. To determine financial stability, ratios such as autonomy, coverage of current assets by equity, maneuverability, and liquidity are applied. The resulting values are compared with baseline figures, which may include expert estimates, industry averages, or competitor data.
- Asset management indicators are calculated based on balance sheet data and the income statement. This large group includes turnover ratios: accounts receivable, inventory, accounts payable, as well as the calculation of the financial cycle. Positive trends in this group are associated with accelerated cash flows, intensified production processes, and other business activity. This indicates business growth and a positive outlook. To assess success, it is important to consider not only company-specific but also industry-wide indicators. A slowdown in turnover may indicate the onset of a crisis, inefficient use of assets, or the presence of other problems within the company.
BI’s balance sheet ratio analysis involves more than just the automated calculation of key metrics. The program compares these metrics with results from previous periods, presenting them in an easy-to-understand graphical format. BI provides details on the underlying data used in the calculations, enabling users to quickly delve deeper into the causes of specific phenomena or trends. The table with the relevant KPIs is always visible, so accessing this information requires no additional effort.
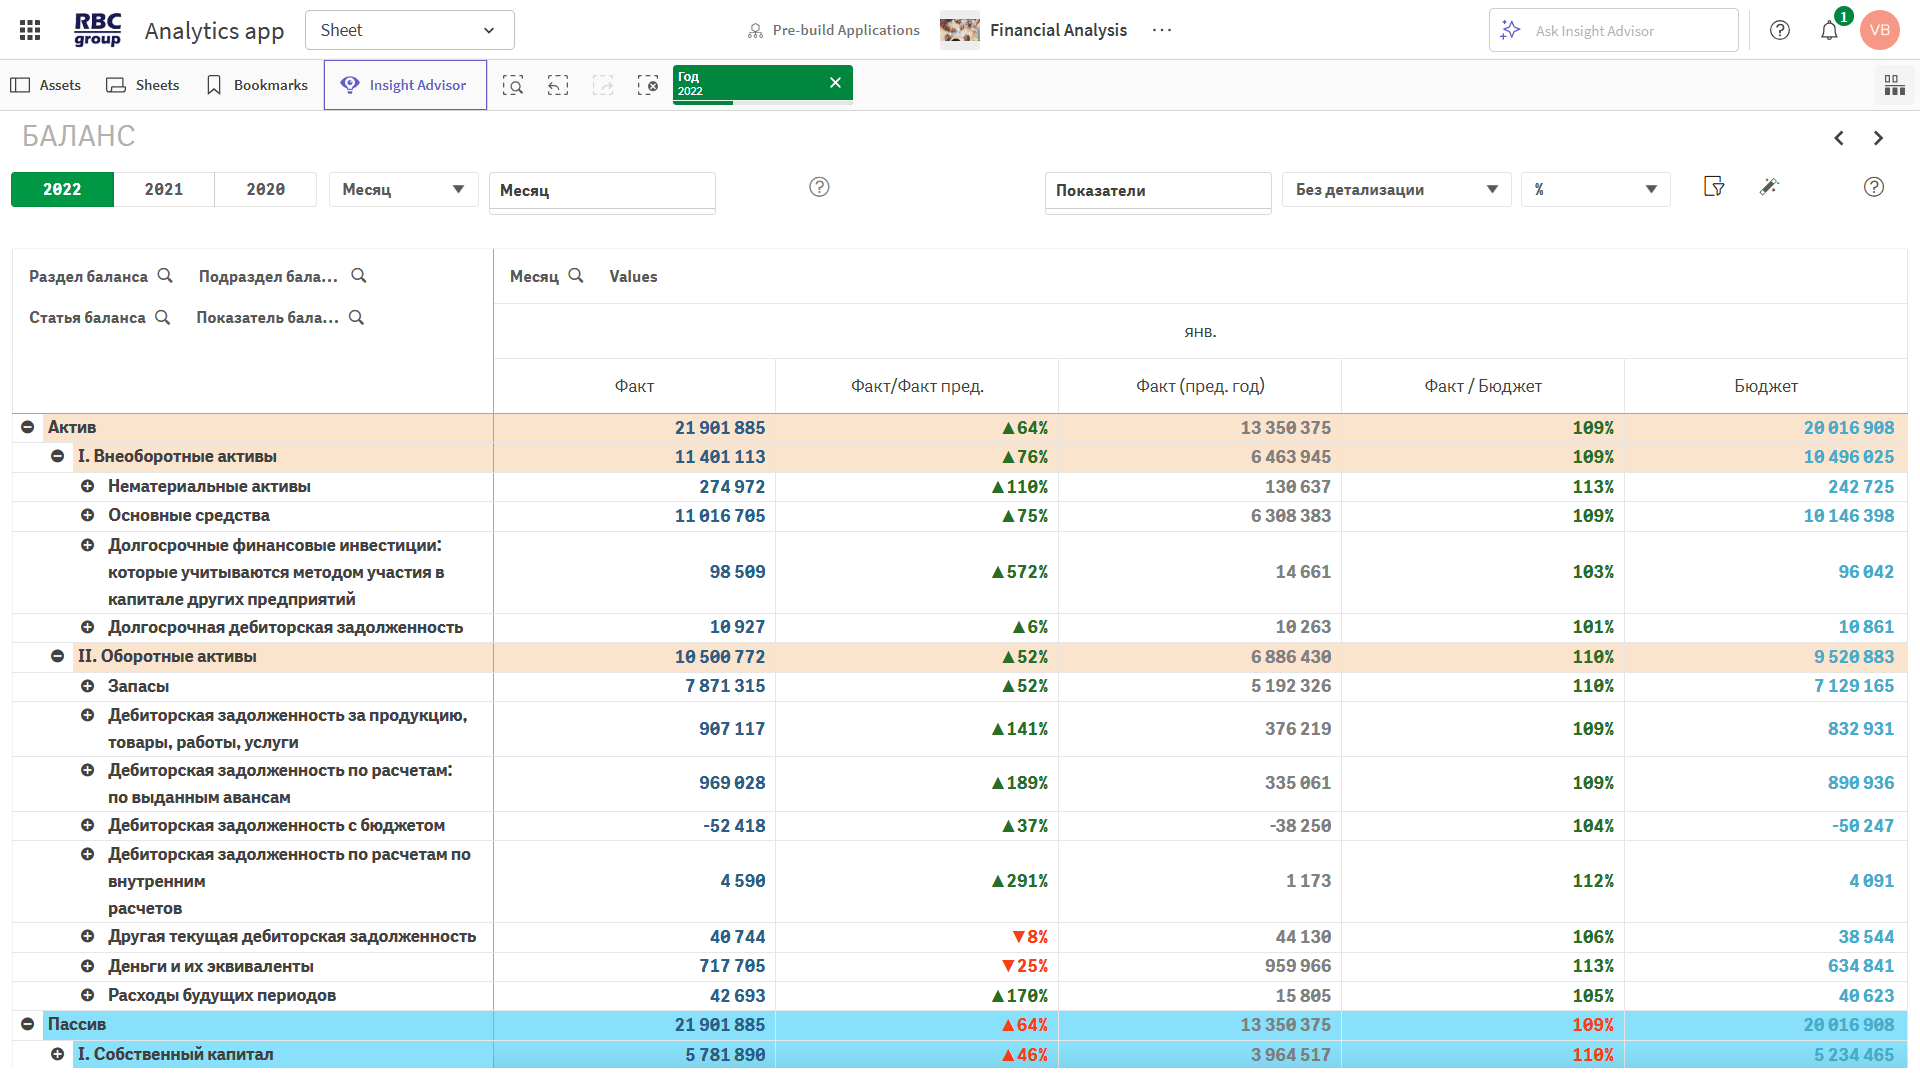
The Specifics of Balance Sheet Analysis Using BI Platforms
Business Intelligence platforms are highly adaptable. They can retrieve data from various sources and quickly transform it into an easy-to-understand format. The software performs horizontal and vertical balance sheet analysis, and the list of ratios required for analysis is a customizable option that subsequently runs automatically and requires no user intervention. Business Intelligence allows you to compare current data with historical data. You can observe changes in the structure of individual balance sheet items and ratios, monitor ongoing changes, and respond to them promptly. In-depth analysis helps identify the root cause of emerging trends and improves the accuracy of forecasts.
By leveraging the capabilities of Business Intelligence, you can:
- have round-the-clock access to balance sheet analysis.
- Create dashboards with key performance indicators (KPIs) that allow you to quickly monitor changes in these metrics and use them to prepare presentations and reports.
- Use both financial and management balance sheets for analysis, with the latter providing a detailed view of cash flow structures. This approach allows you to control the level of data detail depending on the objectives of the balance sheet analysis and the end user’s tasks.
- utilize various analytical tools, making the analysis comprehensive or focused.
- Select the desired period for reviewing metrics. The program has access to historical data and can analyze KPIs for past months or years. This approach allows for the neutralization of seasonal factors, enabling the most objective assessments and forecasts.
- Select the currency for displaying financial indicators, which is particularly relevant in conditions of declining purchasing power of the national currency. Accounting for inflationary factors allows for determining the real dynamics of changes in individual items and more objectively assessing the company’s financial condition and management effectiveness.
- Examine individual balance sheet items in detail. The module’s settings allow you to drill down into specific indicators, such as analyzing accounts receivable by counterparty and due dates, and quickly obtain any other information that is important to your business.
BI helps improve the quality of financial process management. The software quickly processes large volumes of data and simplifies the identification of correlations and trends. Using BI does not require users to have specialized knowledge, as the software features an intuitive interface and structure. All workflows are configured during the application installation.
Key Differences Between Business Intelligence and Traditional Methods of Metrics Analysis
Balance sheet analysis in Business Intelligence avoids the shortcomings of the outdated approach, where analysis is conducted using spreadsheets. The key differences are as follows:
- Data is uploaded to the BI platform centrally and remains unchanged. This ensures that all users have constant access to up-to-date information that requires no manual processing or special preparation for analysis.
- Data processing—calculations and chart generation are performed automatically in real time. Business Intelligence solutions are designed to handle large volumes of data, so they deliver results quickly even when analyzing data spanning several years.
- Data in tabular form, as well as various graphs and charts, are displayed on a single page, allowing for quick navigation deep into the balance sheet and detailed examination of individual metrics. If you notice a certain trend, you won’t have to dig through documentation to find the cause.
- The set of analyzed indicators is customized to the client’s needs. Individual users, companies, and business sectors require a more or less extensive list of ratios for analysis. The ability to customize it according to current needs enhances the user-friendliness of the applications.
A key advantage of balance sheet analysis in Business Intelligence is the reduction in time spent, achieved by using software technologies to replace labor-intensive manual data processing. As a result, all participants in the decision-making process have access to the most accurate and up-to-date information, presented in a format that is easy to understand and further analyze. Based on reliable data, managers and owners can make the right decisions in a timely manner, improve resource efficiency, and respond to emerging negative trends.

