


Sales Analysis: Azerbaijan
The solution enables you to consolidate data from 1C, SAP, Bitrix24, Excel, and any other sources. Analyze sales plan performance by product and product group, sales manager and sales department, point of sale, and region. Make decisions based on reliable and up-to-date information in Azerbaijan


Where are sales currently rising or falling by region, channel, and category?

Which products, customers, and managers generate the highest revenue and profit margins?

Why isn't the plan being met: is the problem with the customers, the product lineup, or the sales channel?

What is the relationship between sales and returns? Are there any negative trends emerging?

Which customers are cutting back on purchases, and which segments remain stable?

How successful are new product launches?

Which products, customers, and markets have hidden growth potential?

How can you model the impact of price, volume, and product mix on revenue and profitability?

Which actions produce real results, and which ones don’t?

How can you quickly identify the factors contributing to a decline in sales and address them?

How can I segment the customer base based on purchase frequency?

How can you manage your product lineup based on sales history?
BI platform


The pre-configured "Sales Analysis" solution on the Qlik Sense BI platform enables you to perform KPI analysis, plan-vs-actual analysis, dynamic analysis, market share analysis, multidimensional analysis, comparative analysis, factor analysis, geographic analysis, ranking analysis, LFL analysis, ABC analysis, XYZ analysis, FMR analysis, market analysis, transactional analysis, and what-if analysis of sales for a company or group of companies. Perform 360º sales analysis for any selected period based on any combination of filters: products, channels, suppliers, and customers
"Sales Analysis" on the Power BI platform is a preconfigured solution that enables comprehensive analysis of key sales metrics using tools such as plan/actual analysis, dynamic analysis, comparative analysis, factor analysis, FRM, LFL, ABC, XYZ, and other types of analysis.
The solution enables 360° sales analysis across all available dimensions: products, customers, and all available groupings, branches, managers, suppliers, and more.
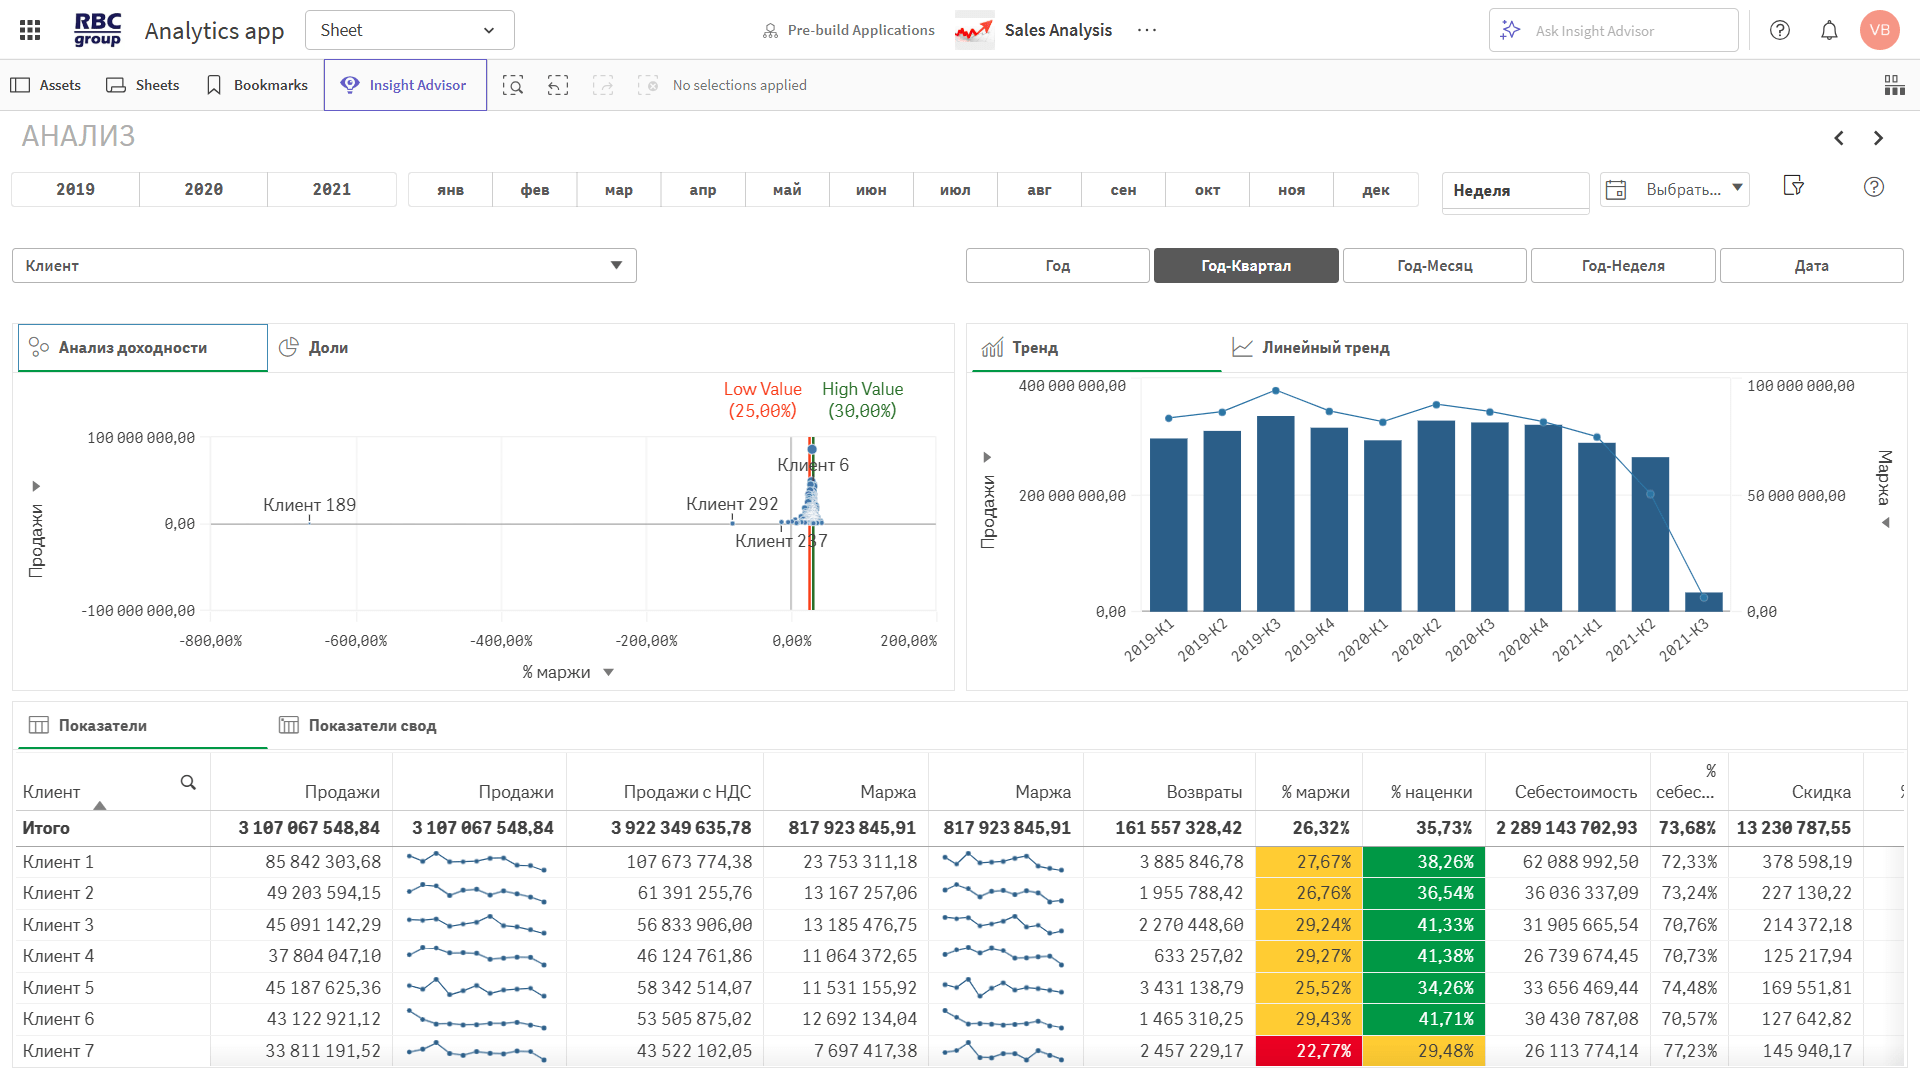
They assess sales trends and the business's actual profitability.
◾ Sales volume — a key indicator of growth and scale
◾ Margin and margin percentage — reflects actual profitability: how much the company earns after direct costs
◾ Discounts and discount percentage — assesses the impact of promotions and the effectiveness of pricing
◾ Returns and % of returns — identify problematic products, customers, or channels
◾ % of sales plan fulfillment — deviations from the target broken down by employees, categories, regions, and points of sale.
Tools for evaluating the customer and product base.
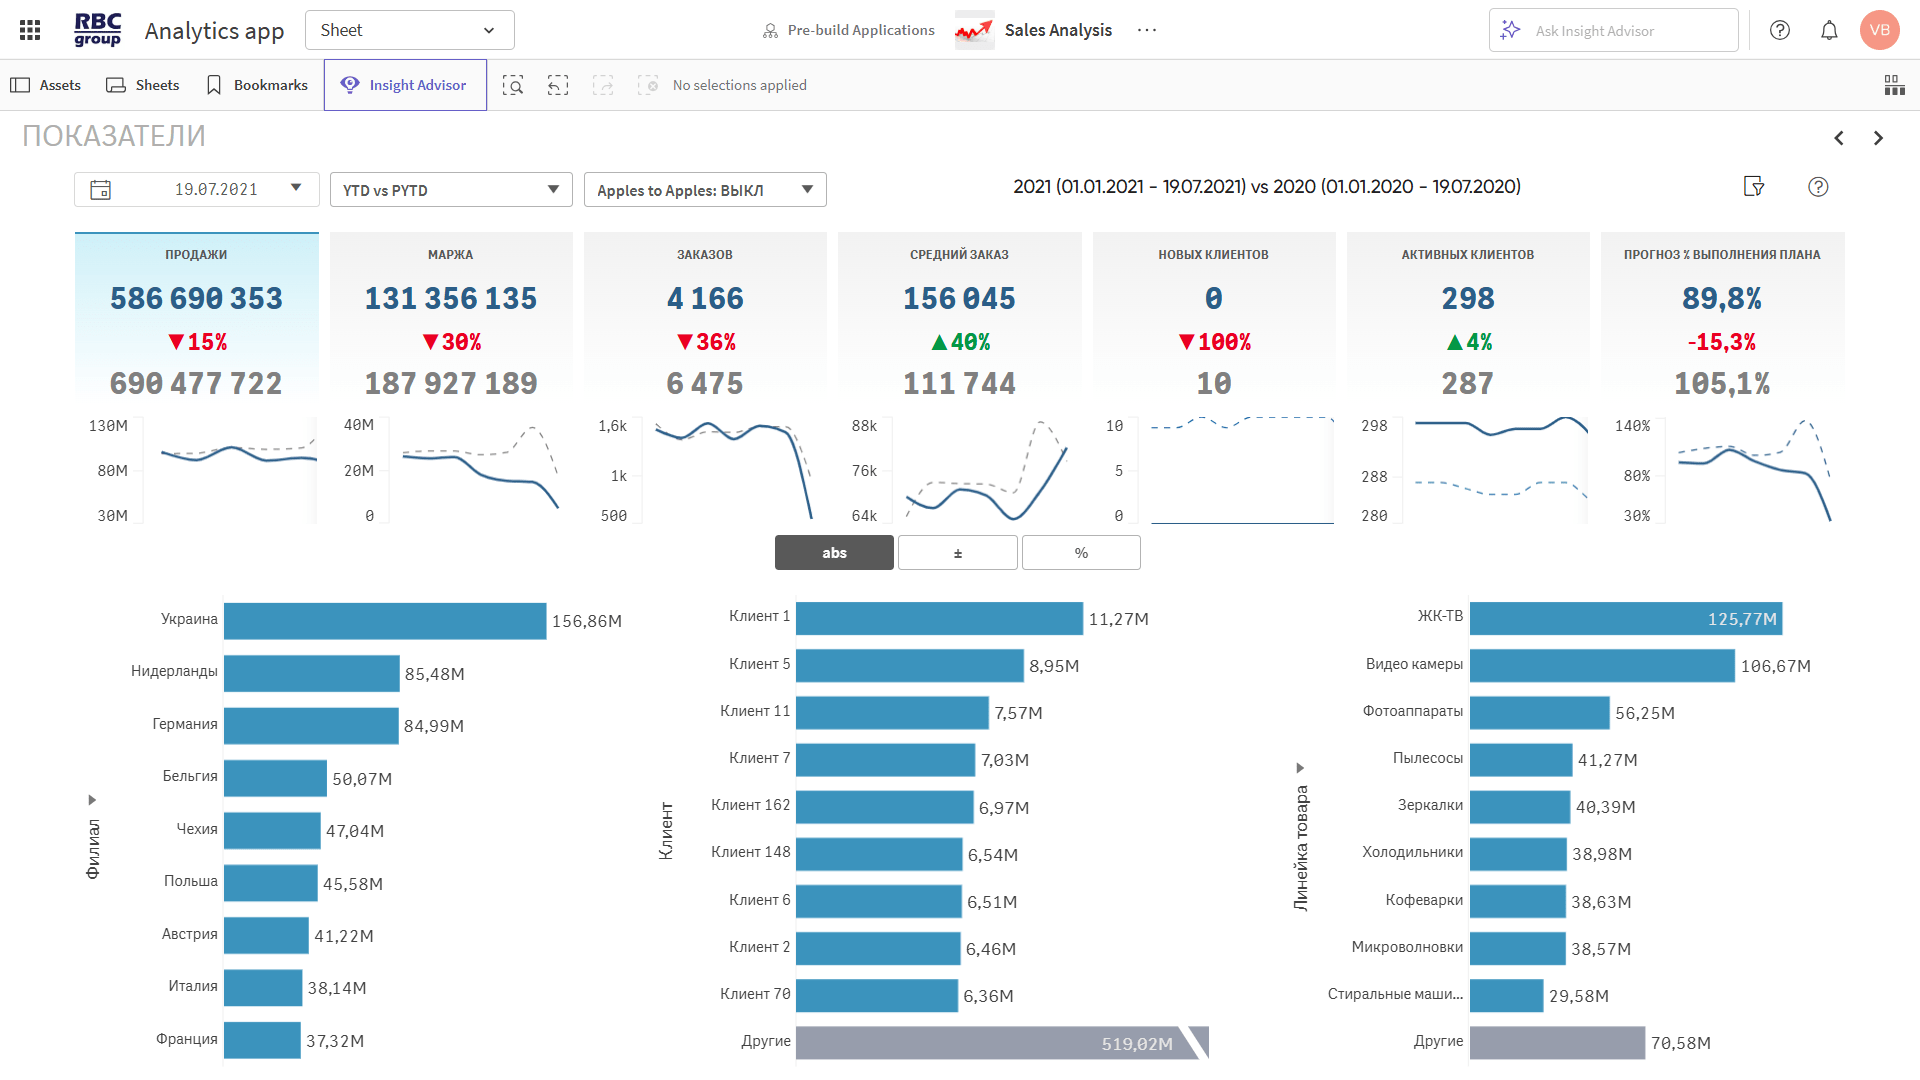
◾ Top customers / products / managers — ranked by revenue, margin, and orders.
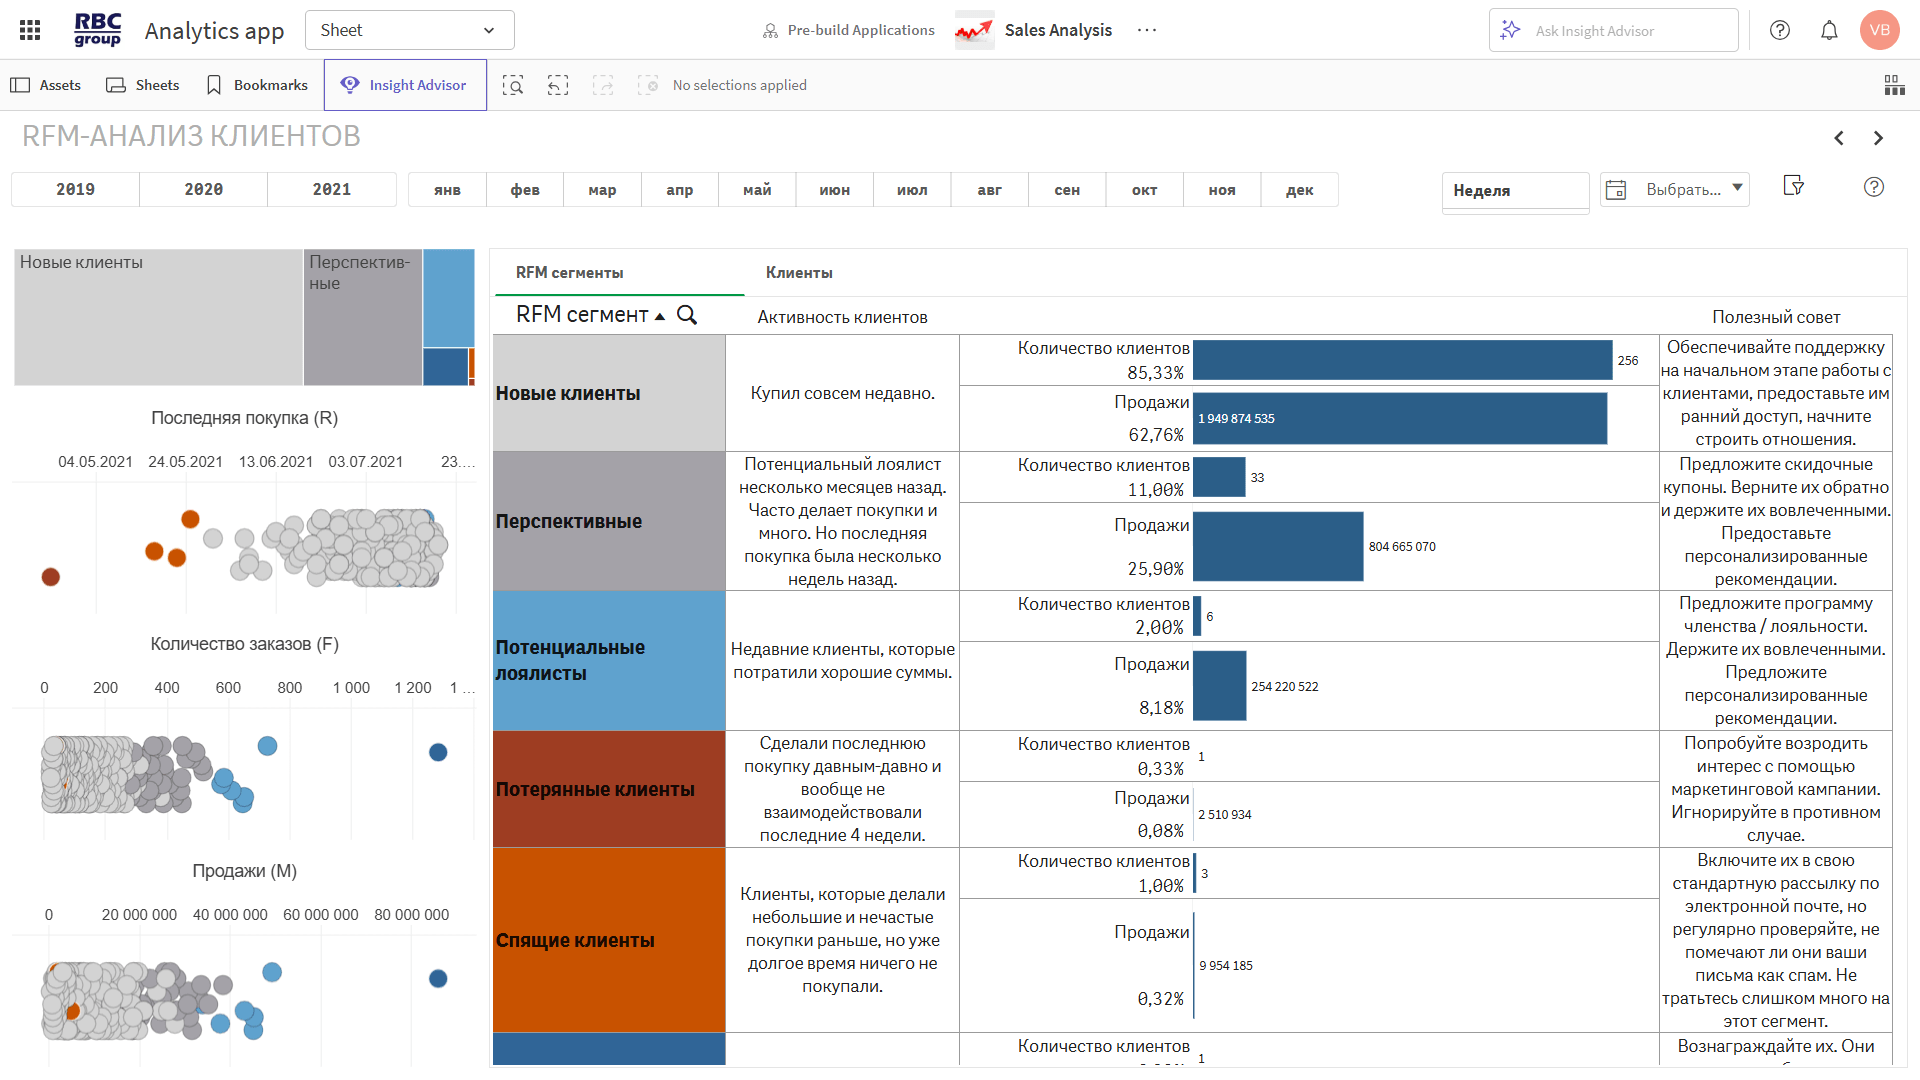
◾ RFM analysis — identifying high-value and declining customers.
◾ ABC/XYZ analysis — classifying the product range by contribution and demand stability.
◾ FMR analysis — inventory management based on sales frequency.
◾ Cluster analysis — automatic segmentation by behavioral patterns.
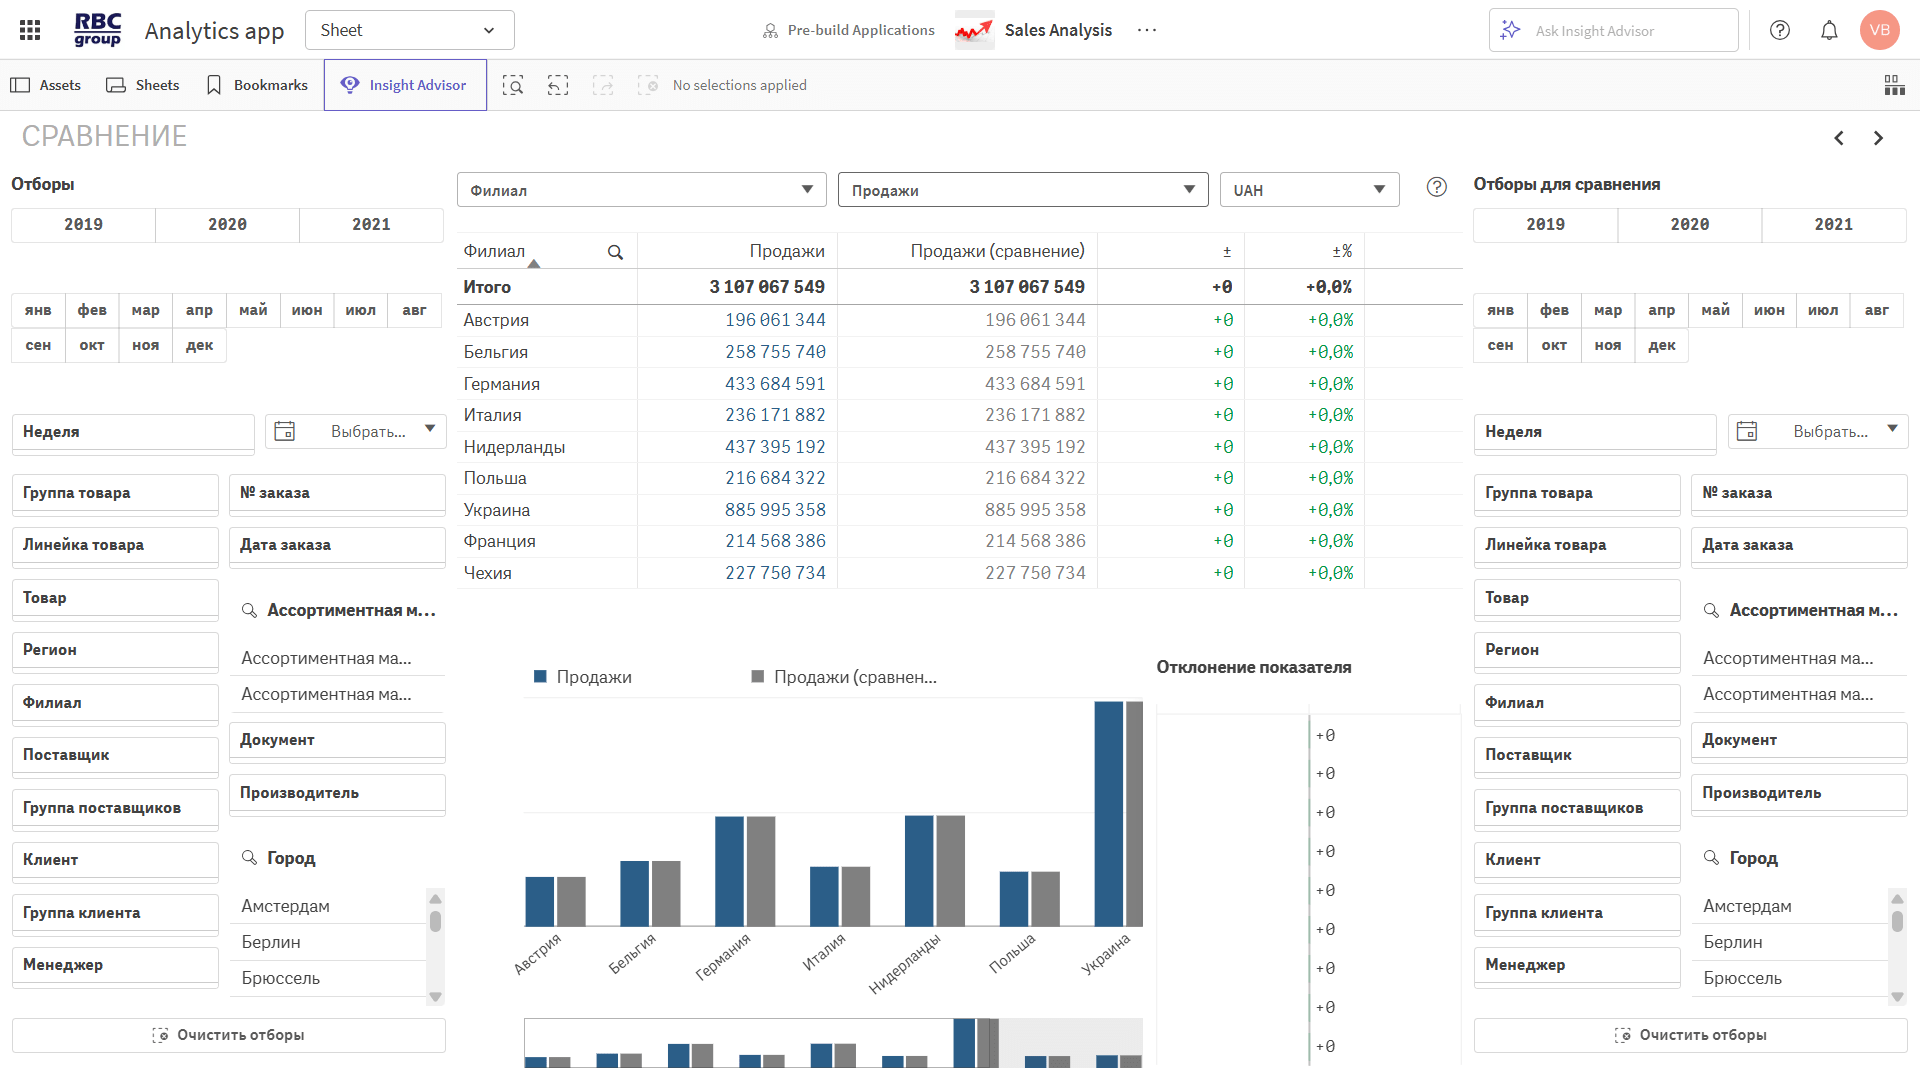
◾ Market share analysis — comparison with competitors by category, channel, and region.
Helps you understand customer value using RFM analysis. Segments the customer base to develop strategies for each segment.
◾ Top Customers — a list of customers who have made recent purchases, order frequently, and spend the most.
◾ Prospects — a list of customers who shop frequently and in large quantities, but whose last purchase was several weeks ago.
◾ Activity Trends — who buys regularly, who buys less often, and who is dropping off. This helps identify “at-risk” customers and respond in a timely manner.
◾ Average receipt/order — measures the effectiveness of upselling and pricing.
◾ Inventory turnover — the speed at which inventory is converted into cash. Critical for reducing inventory costs.
◾ Product range (number of SKUs) — how balanced the product portfolio is.
Assessment of plan implementation and the reasons for deviations.
◾ Actual vs. Plan vs. Forecast — variances and reasons for underperformance.
◾ Plan fulfillment forecast — based on actual trends.
◾ LFL analysis — comparison of sales for stable product groups across different periods.
◾ PVM analysis — contribution of price, volume, and assortment to revenue changes.
◾ Factor analysis — explanation of increases or decreases in indicators.
◾ What-if analysis — scenario modeling under changing conditions.
In just 30 minutes, learn how to get a complete picture of your sales, identify factors driving revenue growth and decline, and pinpoint opportunities for customer and product line development.
We’ll show you a ready-to-use analytical solution with minimal implementation requirements.
Consolidate all your data, analytics, and reports on a single platform based on the DAR concept—for complete control over your sales processes.
Automatically import data from your sources (ERP, 1C, Excel, etc.) to eliminate manual work and errors, thereby speeding up analysis and improving data quality.
Quickly identify areas of growth and deviation using customizable filters by customer, product, region, and manager.
Evaluate customer activity and product portfolio effectiveness using RFM, ABC/XYZ, FMR, and PVM analysis to increase revenue and optimize your product portfolio.
Forecast plan performance, analyze drivers of change, and model development scenarios—to mitigate risks and increase the predictability of outcomes.
Analyze sales trends by region using interactive maps and hierarchical views—enabling quick decision-making based on comprehensive and transparent information.


RBC Group enhances its clients' competitiveness by implementing modern business analytics, data integration and management, artificial intelligence, and advanced analytics systems.


 26
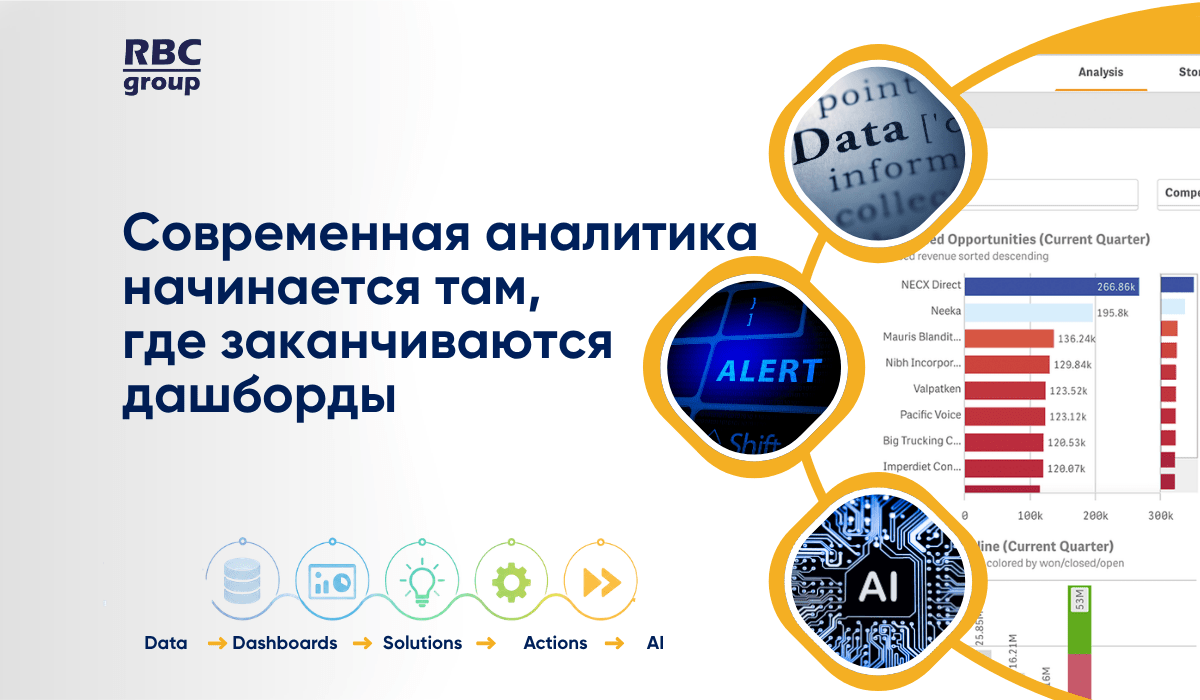
26Современная аналитика — это уже не просто дашборды. Рассказываем, почему бизнесу недостаточно видеть данные и как современные BI-платформы помогают быстрее принимать решения, автоматизировать действия и использовать возможности ИИ.
 35
35Qlik сегодня — это уже не просто BI. На Qlik Community Uzbekistan 2026 участники обсудили будущее аналитики, облачные технологии, интеграцию данных и возможности Agentic AI. Делимся ключевыми выводами и инсайтами мероприятия.
 16
16Почему высокая активность торговых представителей не всегда означает эффективную работу на территории? Рассмотрим ключевые показатели, практические сценарии и подход к управлению торговыми визитами на основе данных.
26Современная аналитика — это уже не просто дашборды. Рассказываем, почему бизнесу недостаточно видеть данные и как современные BI-платформы помогают быстрее принимать решения, автоматизировать действия и использовать возможности ИИ.
35Qlik сегодня — это уже не просто BI. На Qlik Community Uzbekistan 2026 участники обсудили будущее аналитики, облачные технологии, интеграцию данных и возможности Agentic AI. Делимся ключевыми выводами и инсайтами мероприятия.
16Почему высокая активность торговых представителей не всегда означает эффективную работу на территории? Рассмотрим ключевые показатели, практические сценарии и подход к управлению торговыми визитами на основе данных.
Warning: foreach() argument must be of type array|object, false given in /home/rbcgrp/rbcgrp.com/www/wp-content/themes/theme-sp/template/blog.php on line 374

Sales Analysis: Consolidating Data, Optimizing Operations, and Measuring Effectiveness
Sales factor analysis is a method for systematically and comprehensively examining specific factors that influence total sales. The primary goal of sales analysis is to identify ways to increase business profitability, discover new growth opportunities, and pinpoint products and product groups that have not reached their full potential in a given market.
The problem with this approach is that many companies use overly simple, almost primitive algorithms and tools for analyzing sales profitability. For example, they download a few Excel templates from the internet, enter the requested data, and get the analysis results.
Is this method viable? Yes, absolutely.
Does it really provide an objective and useful analysis of sales profitability? That, however, is another question…
RBC Group: We have revised our sales analysis principles and optimized them
We are pleased to present the “Sales Analysis” analytics application, developed using the Qlik BI platform.
The key feature of our solution is the consolidation and analysis of data from 1C, SAP, Bitrix24, Excel, and your other sources. With it, you can analyze sales plan performance by product and product group, manager, sales department, individual retail outlets, or entire regions. It’s as intuitive, accessible, and easy to understand as possible.
Our app is applicable in virtually all areas of modern business and manufacturing:
- retail;
- FMCG sector;
- banking sector;
- pharmaceuticals;
- agribusiness;
- telecommunications;
- distribution;
- restaurants and food service;
- large holding companies, and much more.
If you’d like to learn more about our product’s capabilities, its benefits, and how it can be implemented specifically in your company, please submit a request on our website—a manager will provide you with a free consultation. Yes, sales in these industries differ from one another. It is during the implementation project that all the unique characteristics of the industry or the company are taken into account.
Who needs sales analytics and why
We identify three main groups of people for whom it is essential to understand sales KPIs, conduct comparative analyses, and take the results into account when developing and adjusting business strategies. These are business owners, sales and marketing departments, and IT directors.
Legal Advice for Business Owners and Directors
The app allows you to monitor the progress of sales plans at any stage, analyze key sales metrics, and collect and consolidate real-time data from various sources—all within a highly user-friendly and intuitive interface. It features charts, tables, comprehensive statistics for each period, automatic calculations, and helpful prompts.
Our solution allows you to thoroughly analyze the activities of every customer, every supplier, and every manager. In other words, it lets you dive deep into analytics, identify weaknesses, and optimize your business development strategy.
AP for Sales and Marketing Departments
With our app, you can collect and process large volumes of data from various sources faster and with minimal effort. The system automatically provides sales metrics in both static and dynamic formats and simulates margins based on specified parameters: price, cost, and quantity.
You can also analyze your product matrix and shopping cart in detail, create visual rankings based on specified metrics, manage marketing campaigns using real-time data, and much more.
A Guide for IT Directors
The system allows you to import data from any modern sources and systems, responds quickly to user requests, enables you to make changes promptly, and provides all the necessary tools for independent analysis.
The system is designed to be scalable and deployable directly on Windows and Linux operating systems.
From Theory to Practice: How to Use Sales Performance Metrics in Business
We’ve done our best to create the most versatile solution possible for analyzing data, comparing results across time periods and departments, extracting data from various sources, and so on. But how does this apply in real life? How can these results specifically benefit your business?
So, by using the RBC Group’s analytics app, you’ll be able to:
- Identify and promptly address weaknesses and shortcomings in the sales system and funnel.
- Understand at which stage the business most often loses or fails to retain customers.
- Identify employees whose actions or inactions are harming the business and causing it to lose potential customers.
- Develop and further optimize a strategy for sales growth within the company, as well as for employee development.
- Find new, previously unused tools and methods for attracting customers.
- Significantly reduce customer acquisition costs without decreasing the number of customers.
- Make employees’ work more transparent and open.
To summarize the above, we can conclude that knowing key sales metrics makes it easier to optimize workflows, the company’s budget, and sales themselves. And most importantly, it helps increase the business’s profitability—in some cases, by a factor of several times!
Objects and methods of analysis
For your convenience, we have identified four categories of analysis subjects and the corresponding analytical methods for each:
| SUBJECT OF ANALYSIS | ANALYTICAL METHODS |
| Money (actual profit, revenue, and business profitability) |
|
| Customers (number and composition) |
|
| Processes (procurement and sales efficiency, merchandising, receipt layout) |
|
| Resources (inventory, product range, staff) |
|
Sales analytics is a very broad category of business analysis that encompasses nearly all of a company’s internal processes and areas of operation. Every process, to some extent, influences sales volume and overall profit. And if something is overlooked due to ignorance or carelessness, the consequences for the business’s profitability can be quite significant.
And one more thing…
At the very beginning of this article, we mentioned that you can easily find a wide variety of analytics templates online:
- analysis of sales plan performance;
- analysis of trends by product category;
- analysis of sales structure;
- inventory control;
- ABC analysis, and much more.
This approach is only viable if you’re working with small volumes of incoming data and need only basic calculations. It’s acceptable for small businesses, but out of the question for medium and large ones.
Using basic templates, you won’t be able to effectively structure and organize information; you’ll get “lost” in a huge amount of files and data, inevitably miss something important, and fail to obtain objective results.
If you run a large or medium-sized business (and in some cases even a small one), the tools from RBC Group are exactly what you need. Submit a request on our website, get a free consultation, and request demo access. We’ll surprise you!

