


Analysis of Revenues and Expenses in Azerbaijan
P&L is one of the modules in the "Financial Analysis" analytical application. It enables automatic consolidation of financial statements across a group of companies when accounting is conducted in different accounting systems with varying accounting policies. It includes a ready-to-use analysis methodology and connectors to various accounting systems.


Is it possible to view the P&L by company, business unit, or the entire group?

Which P&L items have the greatest impact on net income?

Where are the key deviations from the budget—by area, Central Federal District, or budget item?

To what extent do the actual figures correspond to last year's figures (LFL analysis)?

How do profit margins and EBITDA change by month and quarter, and what factors influence them?

How are revenue and expenses allocated across the organizational structure, business units, and the Central Federal District?

Which items show unstable or deteriorating trends?

What is the profitability of each P&L line item, and how does it change over time?

How do current revenue, expenses, and profit trends compare to the plan?

What contribution do individual business lines, products, or regions make to profits?

How do depreciation, foreign exchange gains and losses, and taxes affect the bottom line?
How will profits change if there is a change in revenue, costs, or exchange rates?
a BI platform


This preconfigured solution enables KPI analysis, as well as plan-vs-actual, dynamic, percentage-based, comparative, and LFL analysis of financial data for a company or group of companies.
The solution is designed to provide company executives and specialists with tools for quick and convenient analysis across all dimensions: organization, responsibility centers, and departments; P&L items, revenue and expense items; balance sheet items; and cash flow items.
This preconfigured solution enables users to analyze key performance indicators (KPIs) and perform plan-vs-actual, dynamic, percentage, comparative, and LFL analyses of financial data for a company or group of companies.
This solution is designed for executives and specialists to provide them with a convenient and fast tool for analyzing data across various dimensions: organizations, responsibility centers, and departments; income statement items, revenues, and expenses; balance sheet items; as well as cash flow.
These items show the structure of revenues and expenses that make up the final profit.
◾ Revenue
◾ Variable expenses
◾ Contribution margin
◾ Fixed expenses
◾ EBITDA
◾ Operating profit (EBIT)
◾ Net profit
Allow you to track trends and variances for key line items.
◾ Actual / Budget / Previous Period
◾ Absolute and relative variances
◾ LFL analysis for revenue and expenses
Shows each item’s share of the total result and its trends.
◾ An item’s share of the overall structure
◾ Vertical P&L analysis
◾ Breakdown by organization, business unit, and Central Federal District
Help monitor plan execution and assess future prospects.
◾ Budget performance by key categories
◾ Trends by quarter and month
◾ Forecasting of plan performance at the end of the period
Ensure transparency and control at the document level.
◾ Analysis ranging from key performance indicators to source documents
◾ Summary tables organized by P&L structure
◾ Breakdown of line items and their contribution to the bottom line

In just 30 minutes, you’ll learn how a BI solution integrates P&L, cash flow, and the balance sheet into a single model, helping you identify variances, forecast metrics, and manage profitability.
We’ll demonstrate a ready-to-use analytical solution with minimal implementation requirements.
From revenue to net profit—you can see the structure, trends, and variances compared to the plan and the previous period.
This allows you to monitor financial performance at all levels—from the Central Financial Office down to individual line items.
You can drill down into expense categories, view source documents, and use vertical and structural analysis, LFL, and scenario modeling.
BI helps you accurately identify the causes of changes and respond more quickly.
EBITDA monitoring, profitability analysis by business unit, and forecasts for achieving targets help you make informed decisions and optimize costs.
The result is increased profits and better control over cash flows.


RBC Group enhances its clients' competitiveness by implementing modern business analytics, data integration and management, artificial intelligence, and advanced analytics systems.


 26
26Современная аналитика — это уже не просто дашборды. Рассказываем, почему бизнесу недостаточно видеть данные и как современные BI-платформы помогают быстрее принимать решения, автоматизировать действия и использовать возможности ИИ.
 35
35Qlik сегодня — это уже не просто BI. На Qlik Community Uzbekistan 2026 участники обсудили будущее аналитики, облачные технологии, интеграцию данных и возможности Agentic AI. Делимся ключевыми выводами и инсайтами мероприятия.
 16
16Почему высокая активность торговых представителей не всегда означает эффективную работу на территории? Рассмотрим ключевые показатели, практические сценарии и подход к управлению торговыми визитами на основе данных.
26Современная аналитика — это уже не просто дашборды. Рассказываем, почему бизнесу недостаточно видеть данные и как современные BI-платформы помогают быстрее принимать решения, автоматизировать действия и использовать возможности ИИ.
35Qlik сегодня — это уже не просто BI. На Qlik Community Uzbekistan 2026 участники обсудили будущее аналитики, облачные технологии, интеграцию данных и возможности Agentic AI. Делимся ключевыми выводами и инсайтами мероприятия.
16Почему высокая активность торговых представителей не всегда означает эффективную работу на территории? Рассмотрим ключевые показатели, практические сценарии и подход к управлению торговыми визитами на основе данных.
Warning: foreach() argument must be of type array|object, false given in /home/rbcgrp/rbcgrp.com/www/wp-content/themes/theme-sp/template/blog.php on line 374

P&L Analysis
A P&L (Profit and Loss) statement is a separate section that provides a detailed breakdown of a company’s revenues and expenses over a specific period (usually a quarter or a fiscal year). Its net result indicates whether the company lost money or made a profit during the period in question. A P&L statement serves as:
- a basis for decision-making. By understanding how the business operates, managers gain the ability to better manage finances and operational activities;
- a way to take stock. By observing changes in individual metrics, one can assess the success of the chosen strategy.
Regular analysis of the profit and loss statement allows you to view the business as a whole, identify where resources are being allocated, and find ways to optimize operations. To make effective management decisions, the information provided must be as complete and reliable as possible. Business analytics tools are the best way to accomplish this. They automatically collect data, standardize it into a single format, structure it, and transform it into easy-to-understand tables and charts.
Features of the automated solution
The Profit and Loss (P&L) Statement consists of several sheets, allowing users to analyze key data comprehensively and effectively.
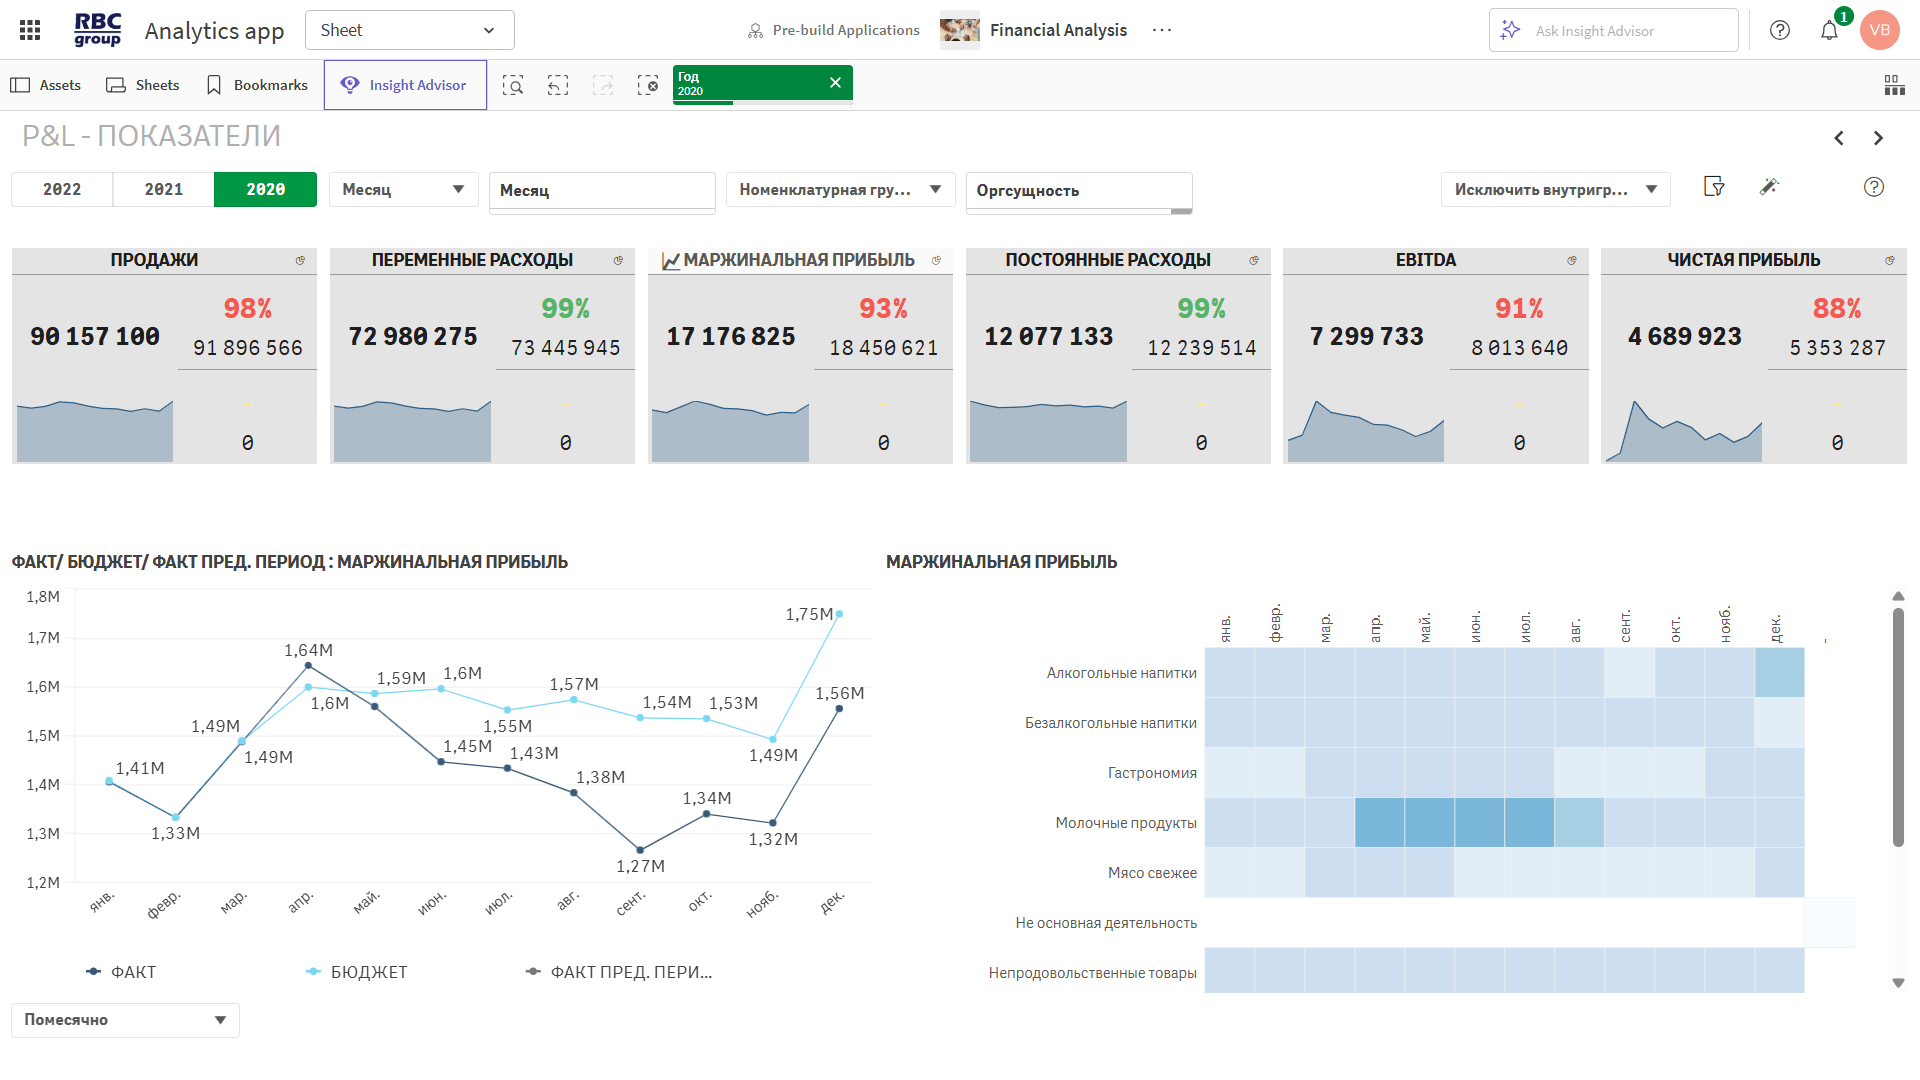
P&L metrics
The first page of the report, which serves as its main page, displays the figures for key income and expense items, allowing users to compare actual figures with budgeted amounts and data from the previous period. Users can select the desired time period for data analysis and specify the currency. The P&L blocks are interactive—clicking on one of them opens a chart showing the trend in value changes and a comparison with the plan or the previous period. During the analysis, you can also specify how to drill down into the selected item and examine its structure in detail.
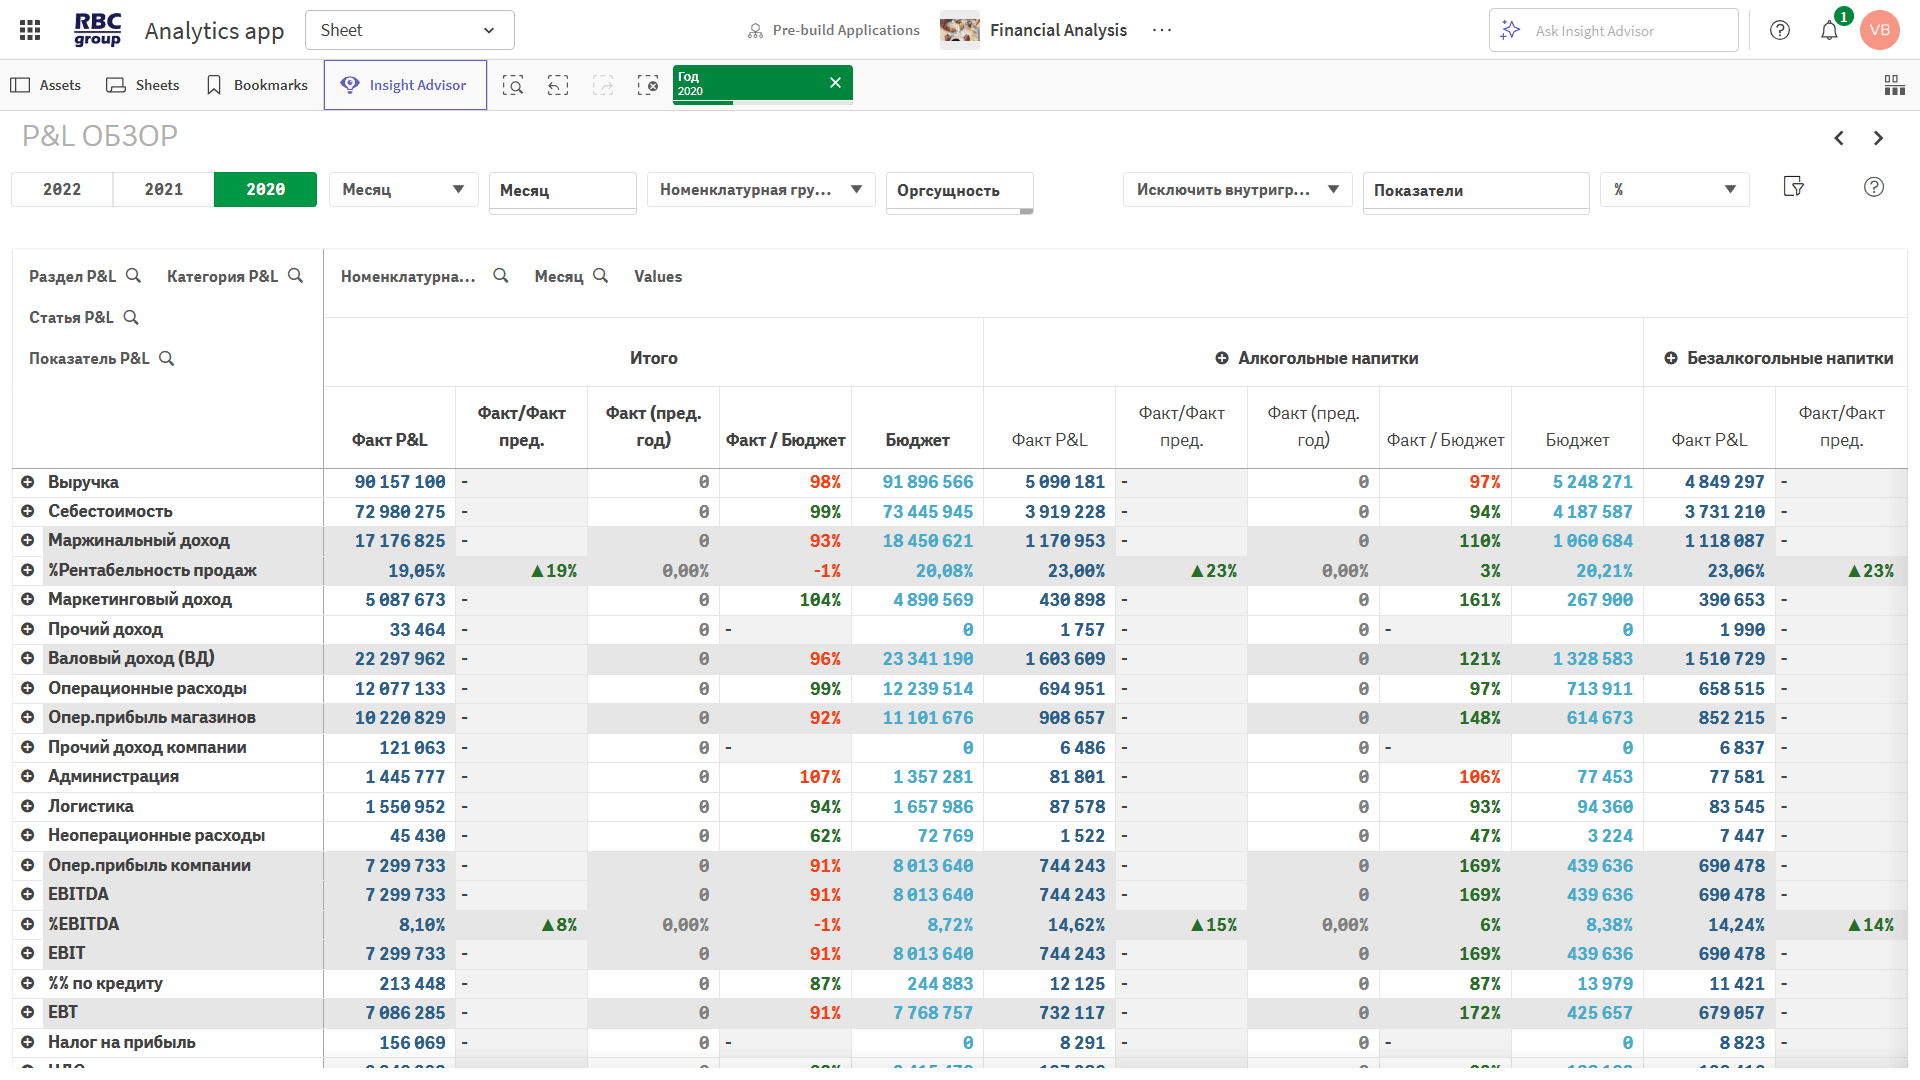
P&L Overview
This is an item-by-item analysis of the income statement, allowing you to compare current data with results from the previous period or budgeted figures. You can also drill down into individual values. This enables you to quickly identify the factors that have had the greatest impact on current results. In addition, the data in the table can be broken down by individual structural groups, such as product lines. The information in the table is automatically converted to a single currency selected by the user, which is particularly convenient for large, multi-regional businesses.
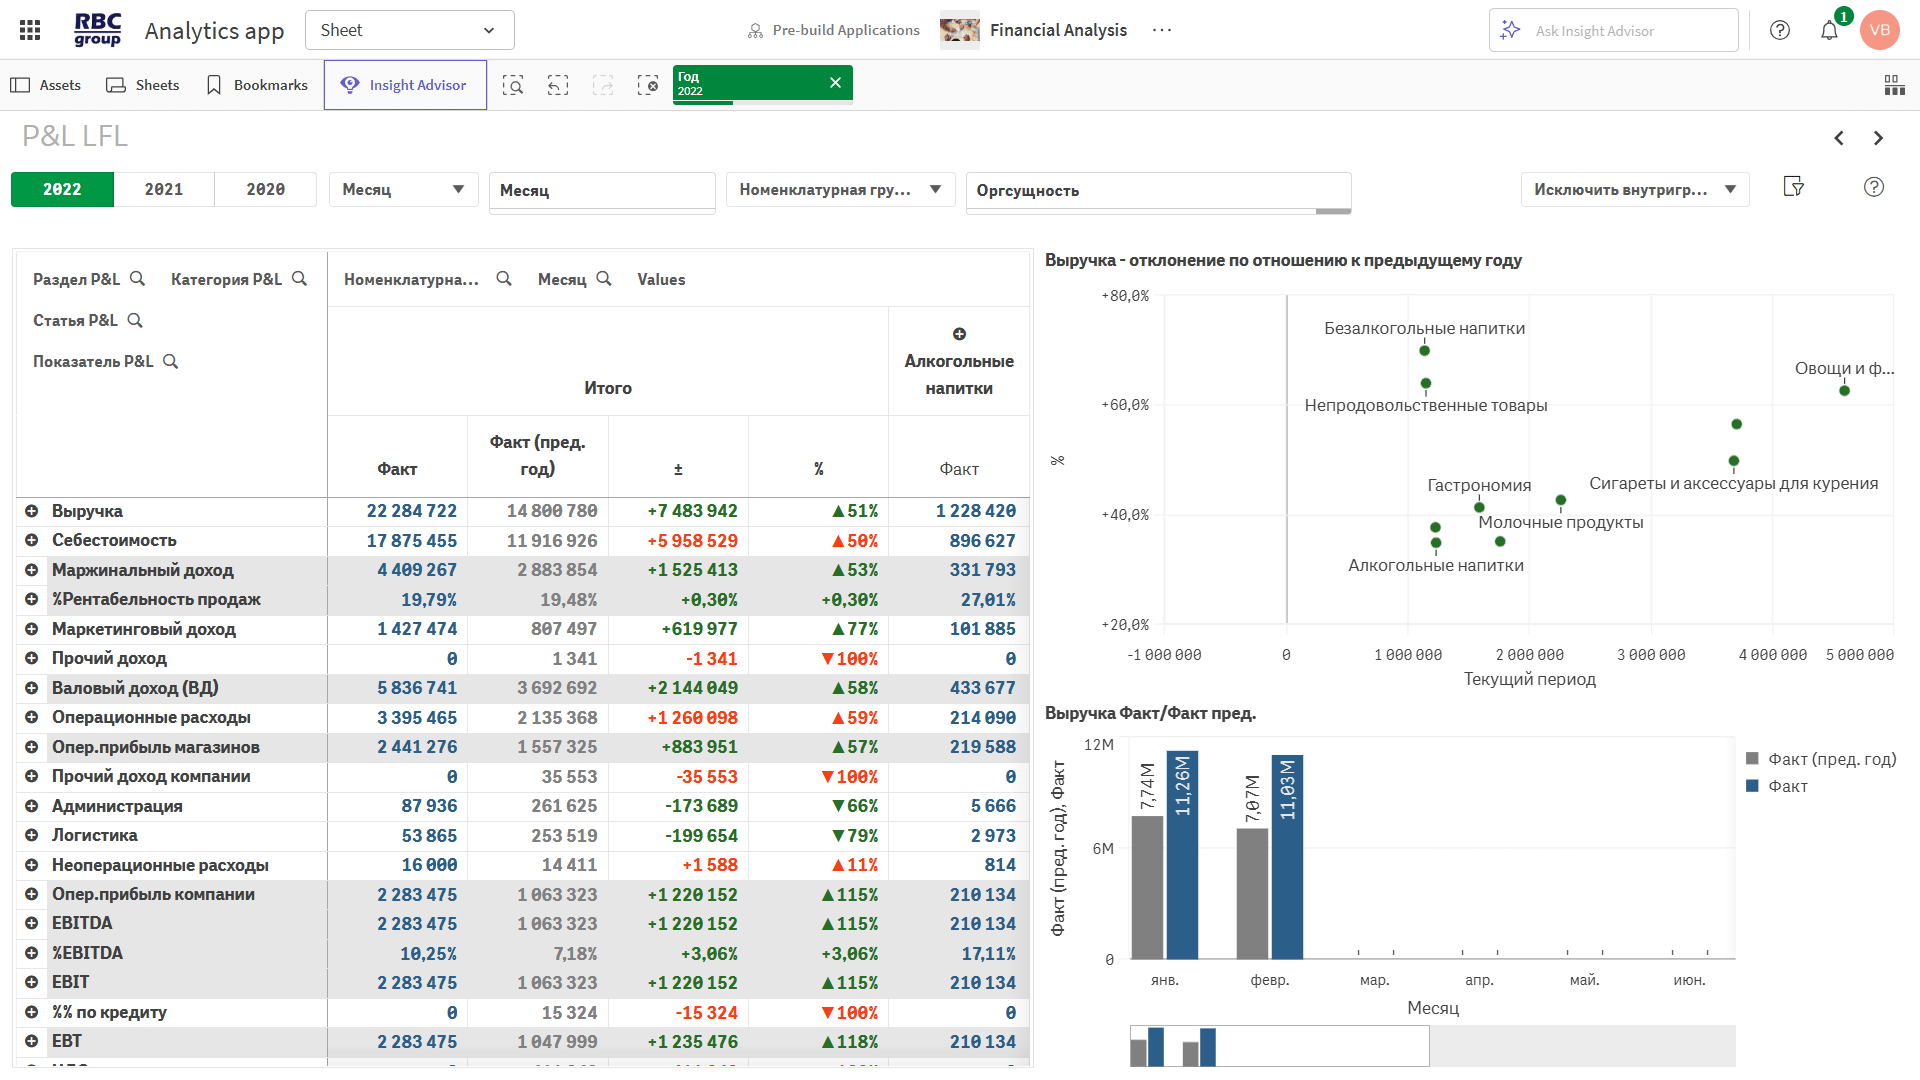
LFL analysis
A “like-for-like” comparison allows you to compare the figures for individual line items in the report with data from the previous period. The table automatically calculates the difference in both monetary and percentage terms. Visualizing the LFL comparison of the selected income or expense line item using charts makes the information easier to understand.
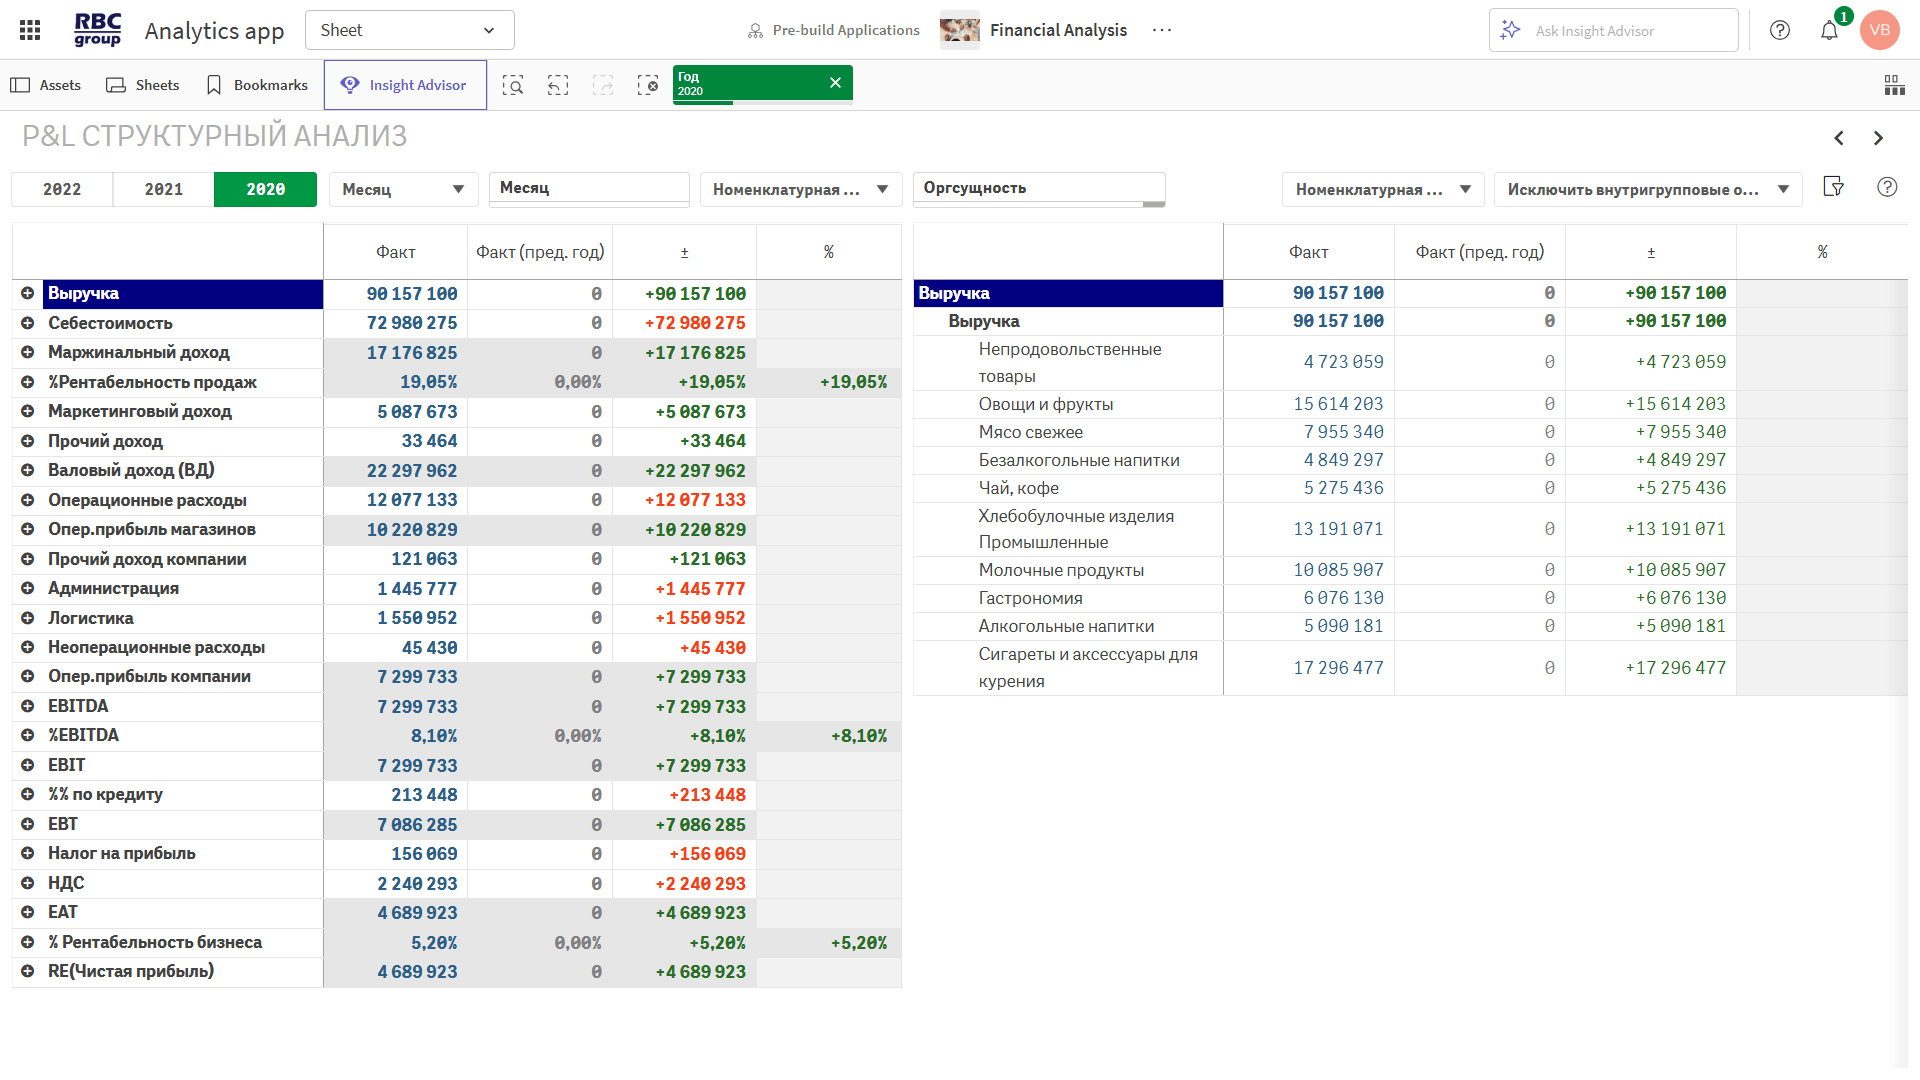
Structural analysis
Designed for a detailed, item-by-item analysis of each report element within a specific breakdown. Depending on the objectives of the P&L analysis, you can specify the method of this breakdown—by product category, store, region, or other parameters. The table displays actual data for the current period, as well as the values of the indicators for the previous period of the same duration. For ease of analysis, the figures are presented in absolute and percentage terms, and their share relative to the total value of the item under review is also indicated.
Comparison of Actual and Budget
It allows you to determine whether a plan has been met or not, expressed in monetary terms and as a percentage. The report’s breakdown makes it possible to identify the components that have the greatest impact on the final result. This approach makes it possible to quickly identify problem areas in the business and pinpoint promising areas for growth.
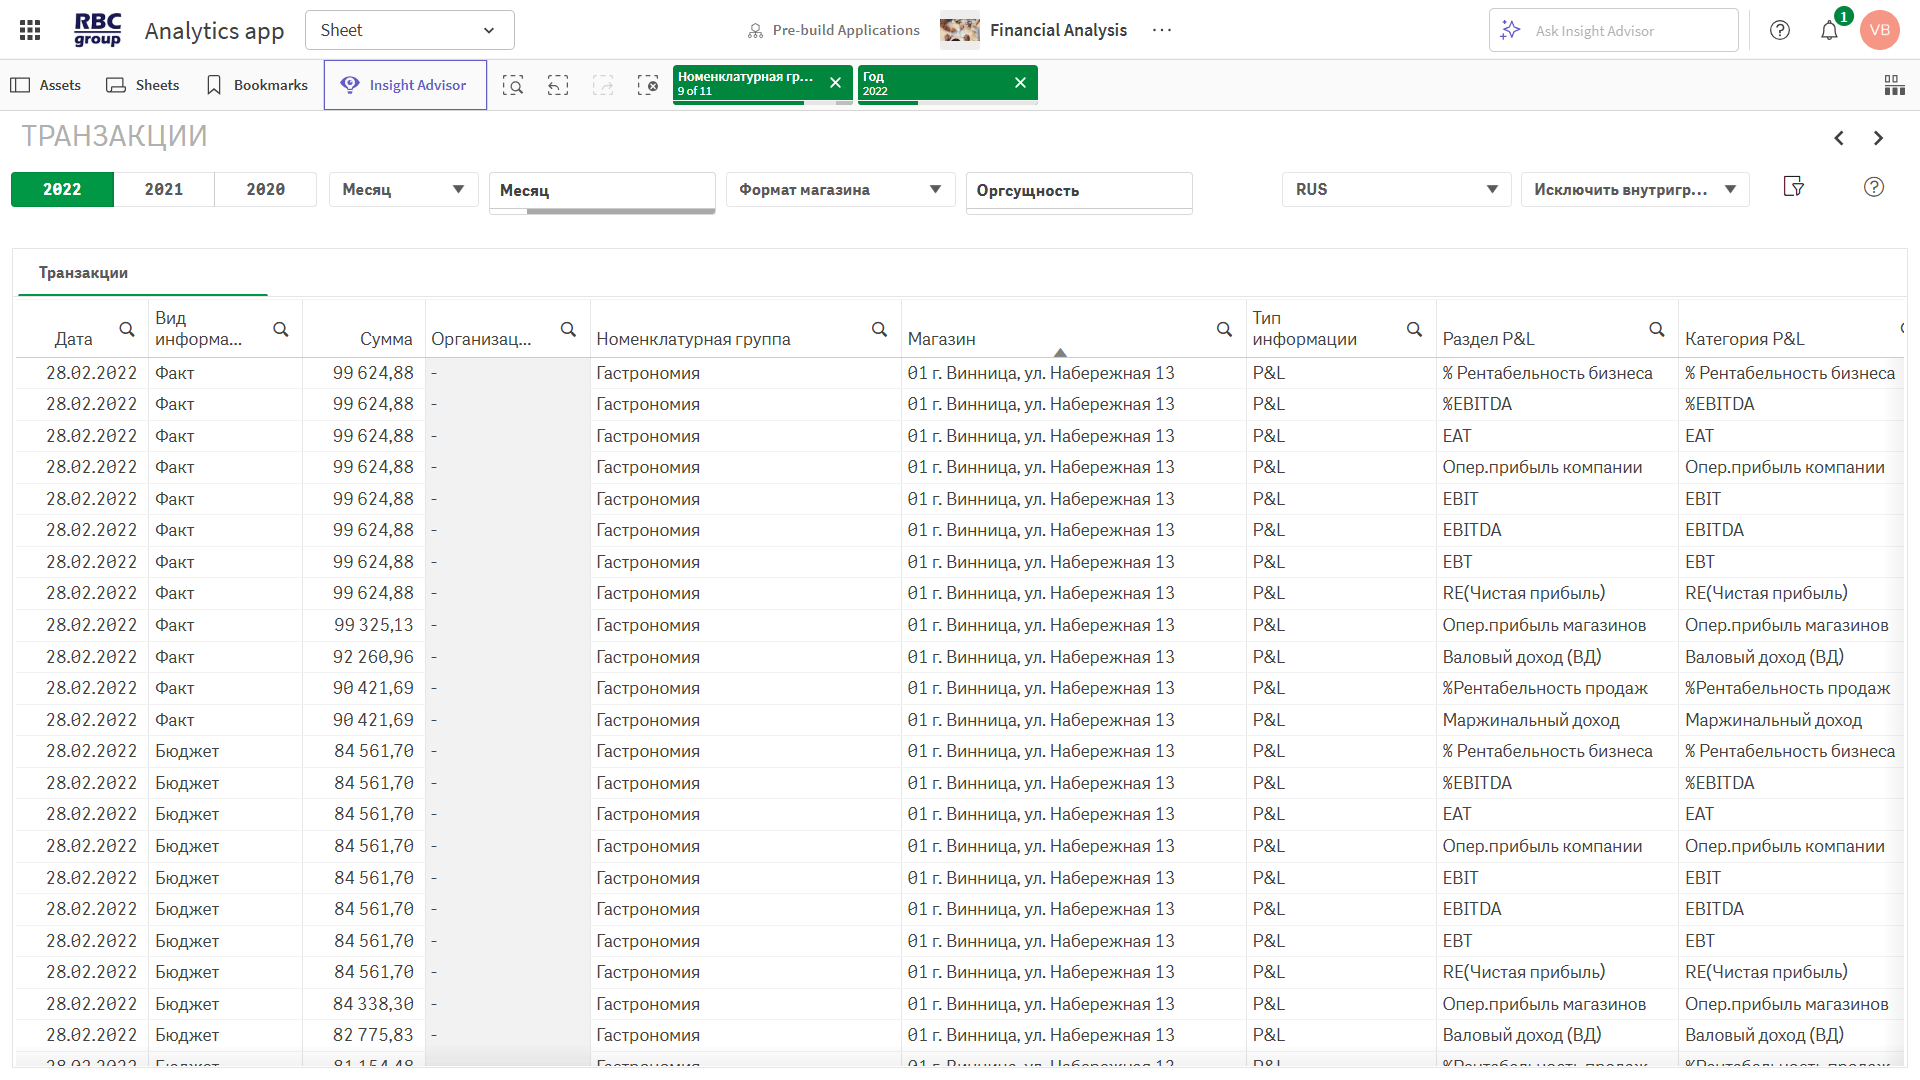
P&L statement
This document provides a list of key performance indicators with a detailed breakdown of their structure. By reviewing this P&L analysis sheet, you can identify which organizational units have the greatest impact on each revenue and expense item, and track changes in their trends and composition.
Trends in revenue and expenses
Allows you to assess the absolute change in key items of the income statement over time. Visualization is achieved through the automatic generation of a bar chart, which enables quick analysis of the main items in the P&L statement. Thanks to tabs featuring budget performance analysis and detailed breakdowns, it is easy to identify potential growth areas and effectively manage key performance indicators.
Comparison of Income and Expenses
Comparing individual line items or the totals of their groups within a single period or organizational unit allows for the rapid identification of structural changes and their objective assessment from the perspective of income and expense analysis.
Interactive report analysis – a new level of data management
The main advantages of BI as a state-of-the-art data management software are its ability to analyze information in depth and comprehensively in real time. Access to changing the level of detail in a report, the time frame of the analyzed period, or the organizational structure is available with a single click. At the same time, there is no need to wait for indicators to be recalculated—updated information in accordance with the user’s request is available immediately.
The automated solution does not simply collect and aggregate data, but correctly groups it in accordance with the specifics of the P&L structure and accounting policies. As a result, users gain easy access not only to general information but can also analyze revenues and expenses in detail by individual business lines, regions, product groups, and other organizational units. The use of color indicators, visual diagrams, and charts helps you interact with large volumes of data more quickly and effectively.
Implementing a modern approach to P&L analysis saves you time on consolidation and reporting. Use it to analyze data and make the right decisions.

