


Receipt Analysis and Loyalty Program in Azerbaijan
The app allows you to create a buyer persona, plan promotional and marketing campaigns, and evaluate their results. Make decisions to increase the average transaction value, conversion rates, and the number of transactions at your stores in Azerbaijan


Which payment method do customers use most often (credit card, cash, rewards)?

To what extent does a loyalty program affect the average receipt amount and purchase frequency?

How can you use a customer’s purchase history to create a personalized offer?

How can you determine a customer's value based on purchase frequency and sales volume?

Which customer segments are prone to churn?

Which items contribute to a high total?

Which channels perform best by segment?

Which customers shop frequently?

Which customers have the highest receipts?

How long ago did the customer make a repeat purchase?

What is the workload at the cash registers by day and during business hours?

Which items are most commonly included on a single receipt?

The solution enables a 360° analysis of the company’s sales receipts across all required dimensions: points of sale (regions, stores, registers, cashiers, etc.), products and all available product groups, loyalty cards, and customer segmentation (gender, age, etc.). The application analyzes the number of receipts, average receipt value, sales volume, number of customers, conversion rate, percentage of sales made with loyalty cards, payment type and discounts provided, the amount of bonuses accrued and redeemed on discount cards, the number of items on receipts, and penetration.
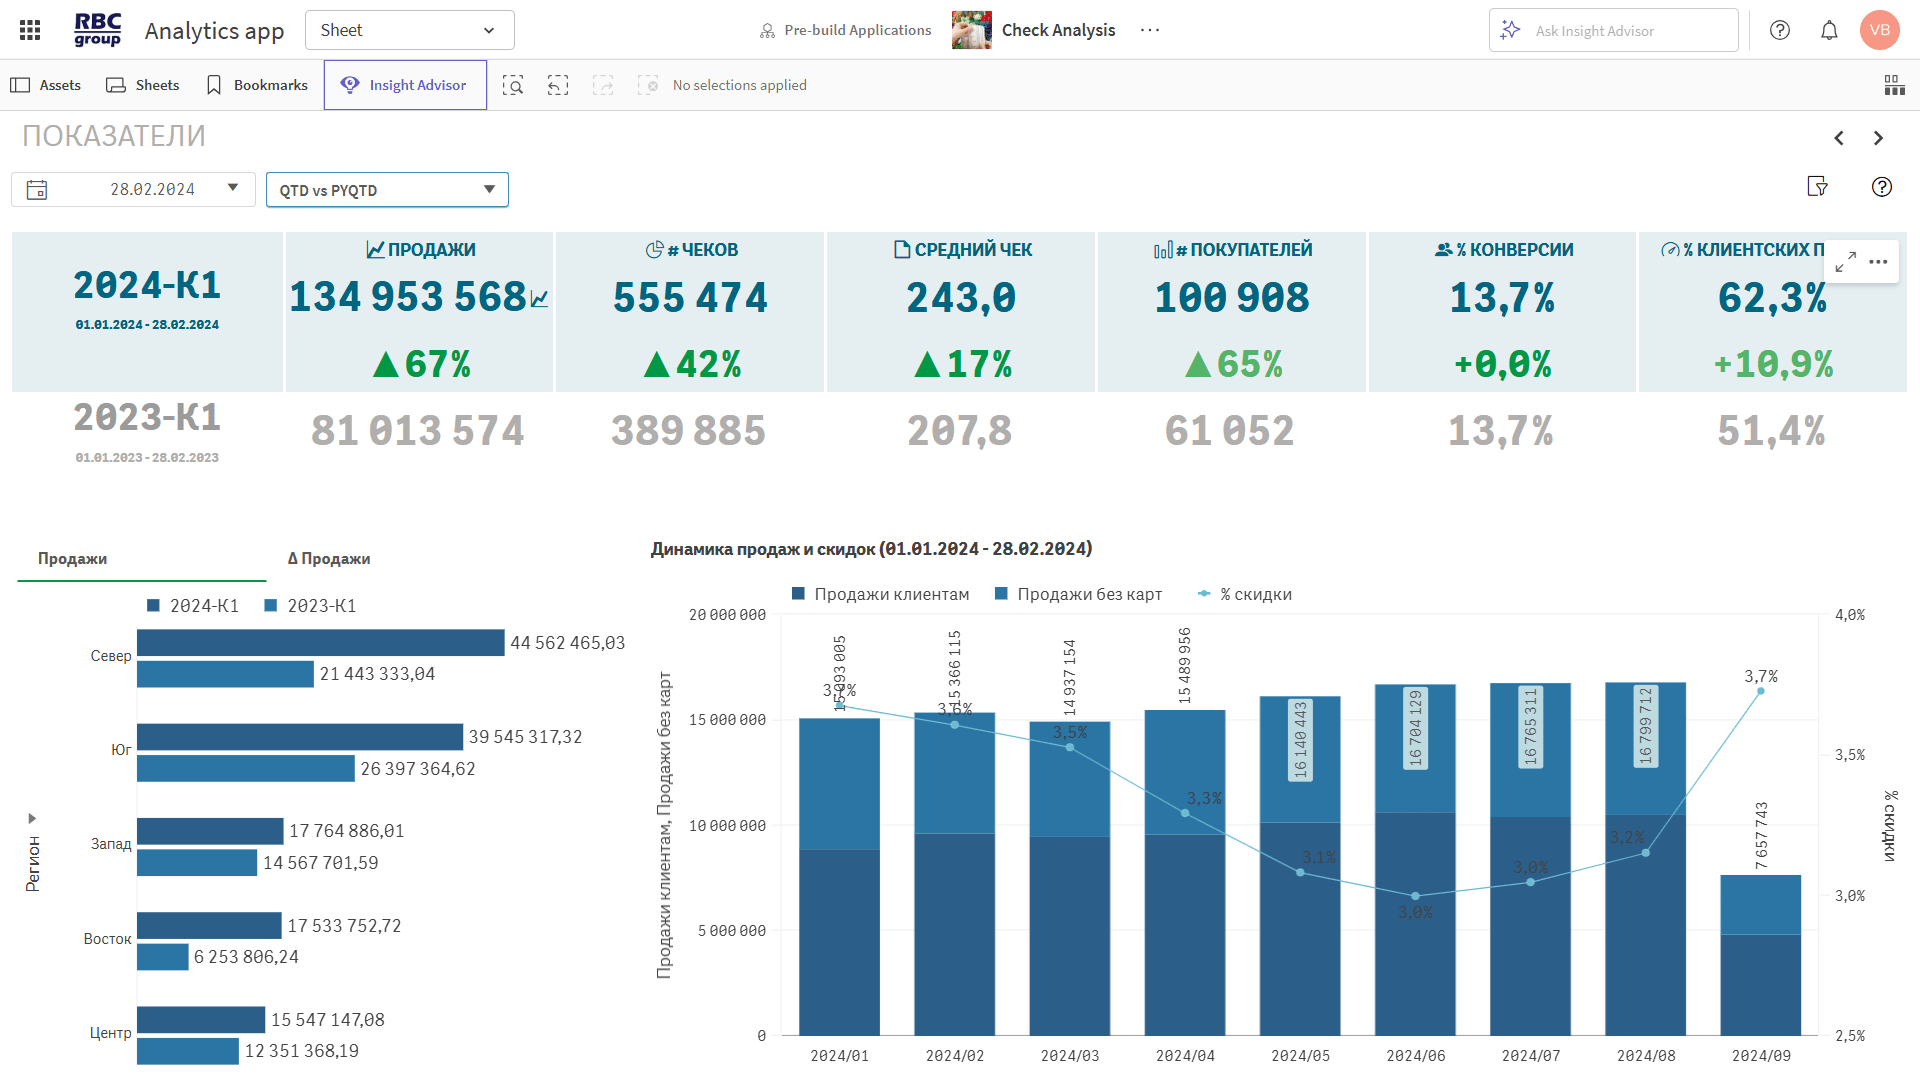
Displays sales volume and receipt breakdown by various segments.
◾ Total sales — broken down by customers with and without loyalty cards.
◾ Number of receipts — by type, region, and store.
◾ Average receipt — for all customers and separately for cardholders.
◾ Number of customers — the number of customers with a loyalty card.
◾ Conversion rate — the ratio of the number of receipts to the number of visitors.
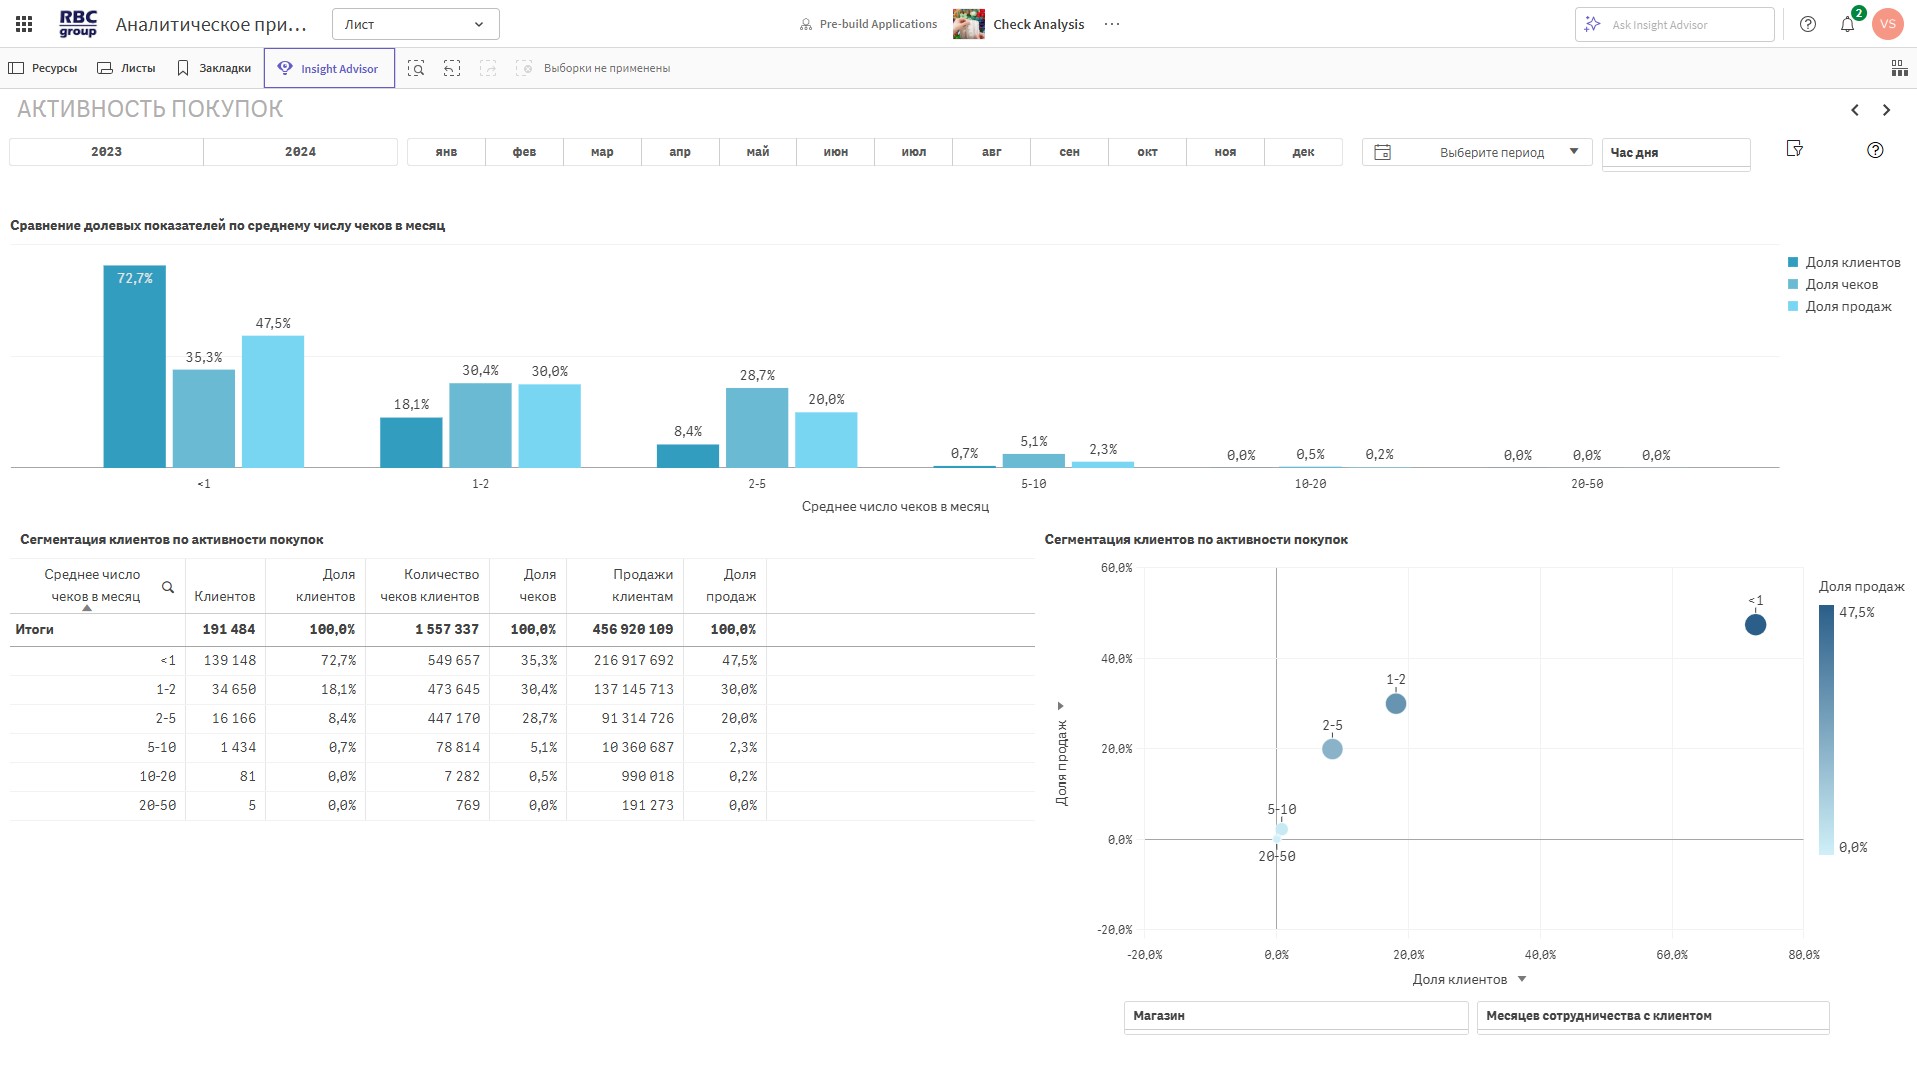
Describe customer activity, engagement, and behavioral trends.
◾ Number of customers — total, new, regular, and returning.
◾ Average number of receipts per customer for the period — segmentation by activity.
◾ Customer purchase volume for the period — customer value assessment.
◾ Time since purchase — date of the customer’s last receipt
They evaluate customer participation in promotions and the effectiveness of loyalty programs.
◾ Total discounts and discount percentage—broken down by receipts and products.
◾ Percentage of receipts with discounts — a clear indicator of promotion reach.
◾ Accrued and redeemed bonuses — level of program participation.
◾ Percentage of bonus redemption — effectiveness of the bonus program.
Analyze customer engagement and distribution across behavioral segments.
◾ % of customer sales — the share of sales made using loyalty cards.
◾ % of customer receipts — the share of receipts from registered customers.
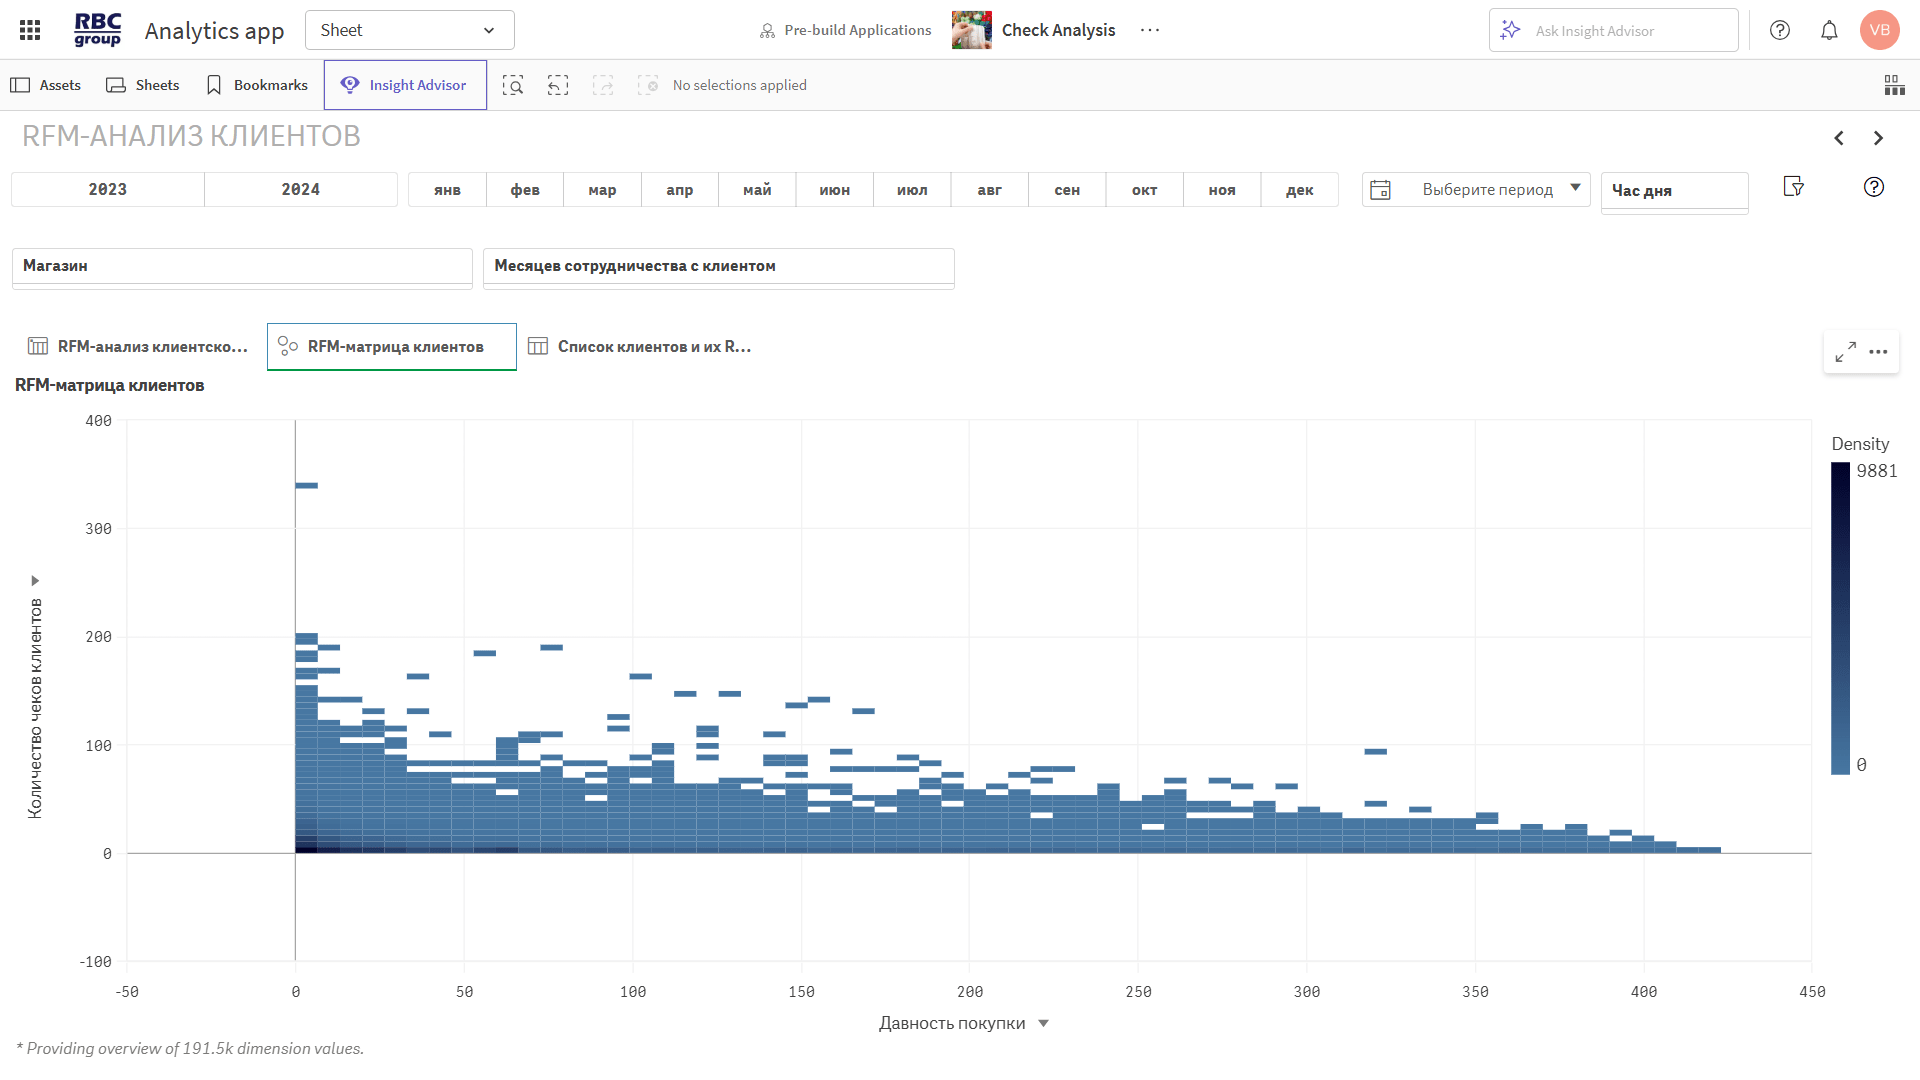
◾ RFM analysis — recency, frequency, and monetary value of purchases.
◾ Customer clusters — segmentation based on behavioral characteristics.
These metrics show which products drive demand and influence customer behavior.
◾ Product penetration — the share of products in sales and receipts.
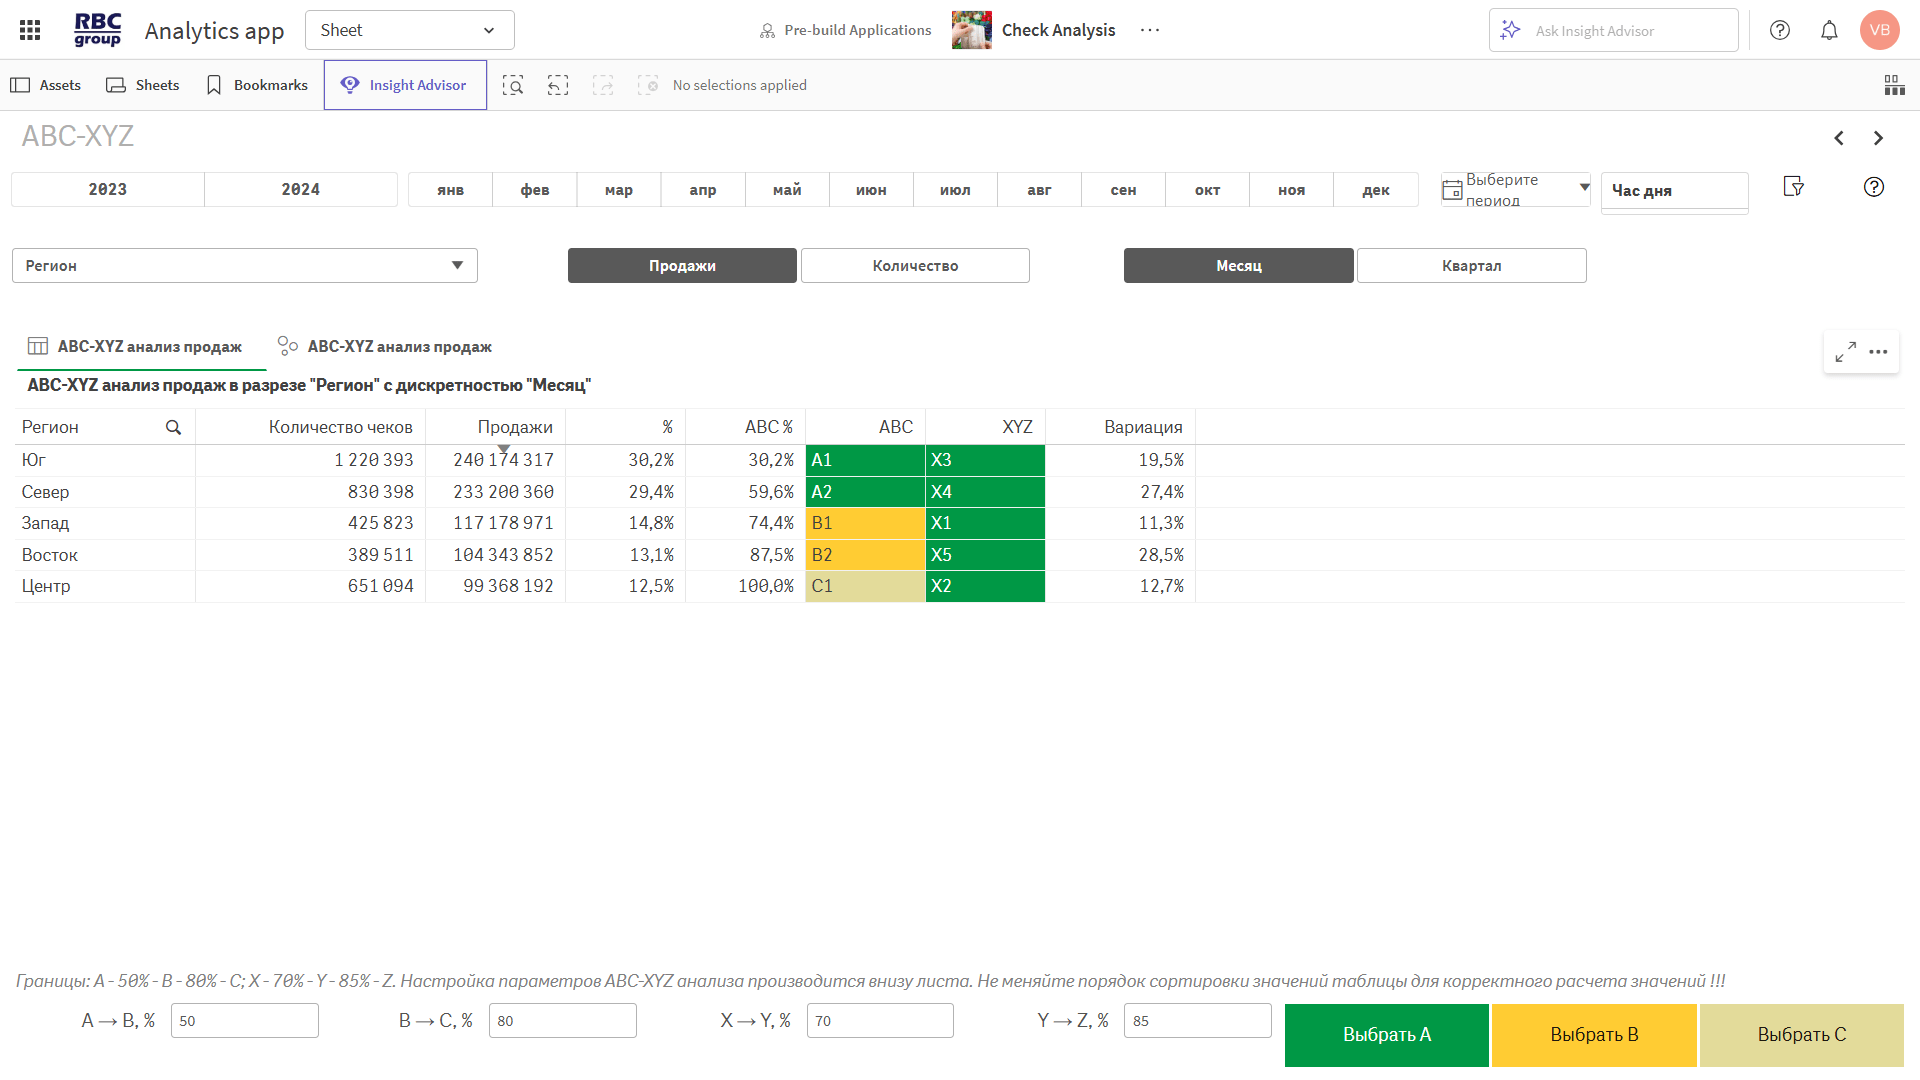
◾ ABC/XYZ analysis — the share and stability of sales by product.
◾ RFM analysis of products — popular and underperforming items.
These tools help identify trends, seasonality, and anomalies across various dimensions.
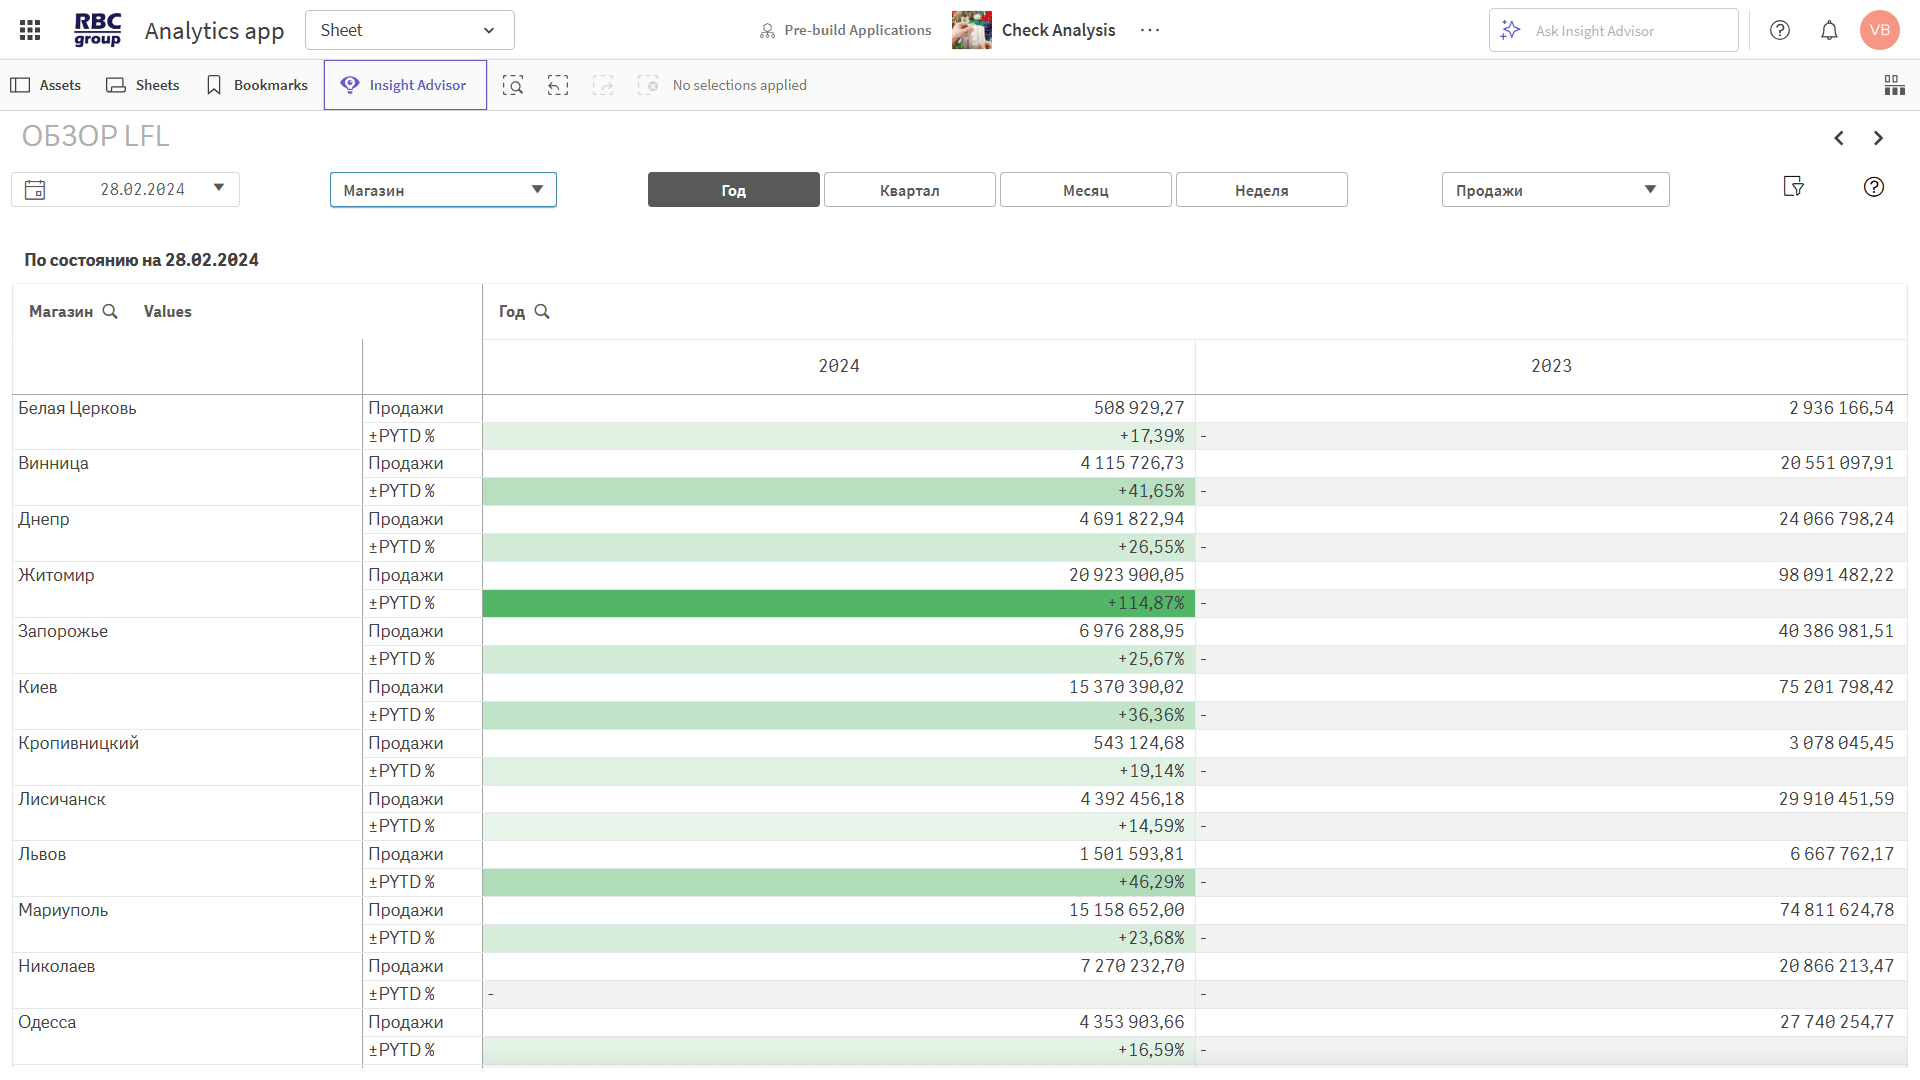
◾ LFL analysis — comparison by period and store.
◾ Trends in receipts, sales, and customers — by day, week, and month.
◾ Comparison of segments, stores, and periods — identification of deviations.
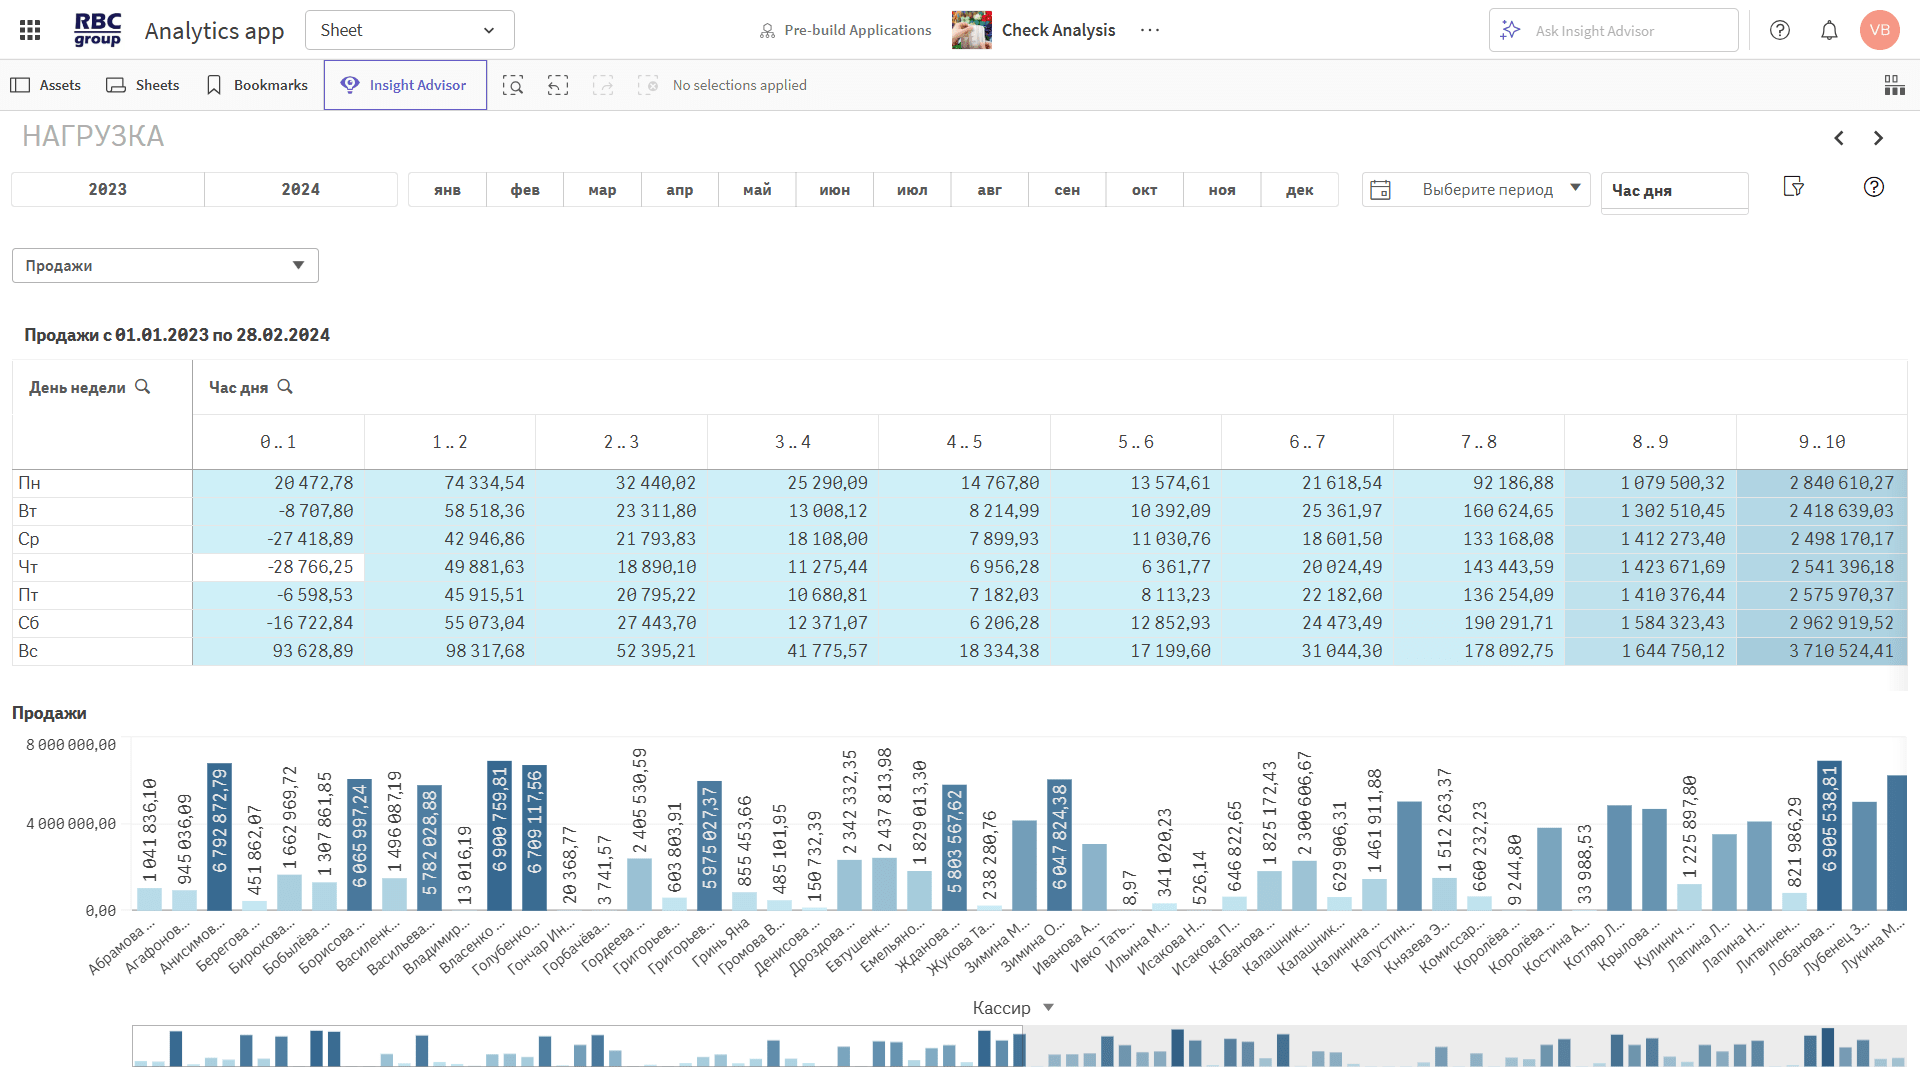
Analyzes cash register workload and customer flow trends.
◾ Number of receipts — by time of day and day of the week.
◾ Number of items per receipt — by time of day and day of the week.
◾ Number of cashiers — by time of day and day of the week.
◾ Number of cash registers — by time of day and day of the week.
Integrating data from POS systems, CRM, and Excel allows you to view sales, receipts, customers, and purchasing behavior all in one place.
The platform analyzes bonuses, discounts, RFM segments, and customer clusters, enabling precise customization of loyalty programs.
The app helps track changes in demand, compare stores and time periods, identify anomalies, and evaluate the effectiveness of promotions.


RBC Group enhances its clients' competitiveness by implementing modern business analytics, data integration and management, artificial intelligence, and advanced analytics systems.


 26
26Современная аналитика — это уже не просто дашборды. Рассказываем, почему бизнесу недостаточно видеть данные и как современные BI-платформы помогают быстрее принимать решения, автоматизировать действия и использовать возможности ИИ.
 35
35Qlik сегодня — это уже не просто BI. На Qlik Community Uzbekistan 2026 участники обсудили будущее аналитики, облачные технологии, интеграцию данных и возможности Agentic AI. Делимся ключевыми выводами и инсайтами мероприятия.
 16
16Почему высокая активность торговых представителей не всегда означает эффективную работу на территории? Рассмотрим ключевые показатели, практические сценарии и подход к управлению торговыми визитами на основе данных.
26Современная аналитика — это уже не просто дашборды. Рассказываем, почему бизнесу недостаточно видеть данные и как современные BI-платформы помогают быстрее принимать решения, автоматизировать действия и использовать возможности ИИ.
35Qlik сегодня — это уже не просто BI. На Qlik Community Uzbekistan 2026 участники обсудили будущее аналитики, облачные технологии, интеграцию данных и возможности Agentic AI. Делимся ключевыми выводами и инсайтами мероприятия.
16Почему высокая активность торговых представителей не всегда означает эффективную работу на территории? Рассмотрим ключевые показатели, практические сценарии и подход к управлению торговыми визитами на основе данных.
Warning: foreach() argument must be of type array|object, false given in /home/rbcgrp/rbcgrp.com/www/wp-content/themes/theme-sp/template/blog.php on line 374

Receipt Analysis and Loyalty Programs
Analyzing sales receipts is not just a way to objectively assess sales volumes. It is also an effective method for promptly identifying sales declines and their causes, pinpointing current issues with the product lineup, uncovering shortcomings in the marketing strategy, and even evaluating staff performance.
RBC Group offers a comprehensive, pre-configured solution called “Receipt Analysis and Loyalty Programs,” built on the Qlik Business Intelligence platform. With this solution, you can analyze average receipt values and loyalty programs across all relevant dimensions:
- points of sale;
- product categories;
- loyalty cards, etc.
The app can quickly analyze the number of receipts, average receipt value, sales volume, number of customers, conversion rates, and sales among loyalty card holders, customers’ preferred payment methods, and more.
Receipt Analysis and Loyalty Program Analysis: What They Offer Businesses
Data from receipts and loyalty programs offer business owners far more opportunities than many realize. By using our software solution, you’ll be able to handle a wide range of tasks more efficiently:
- Monitor the performance of the retail network more accurately and in greater detail based on sales receipt data and loyalty program metrics.
2. Objectively evaluate the effectiveness of marketing campaigns and adjust their strategy as needed.
3. Quickly obtain up-to-date data from POS software and CRM systems.
4. Significantly reduce the time and labor required for data collection and processing.
5. Evaluate the performance of cashiers and the workload at different registers to optimize the workflow.
6. Analyze visitor traffic and conversions, average receipt value, total number of receipts, and average number of items per receipt.
7. Monitor the status of customer cards and card accounts, as well as the bonuses associated with them.
8. Obtain comprehensive customer analytics.
9. Segment the customer base for deeper and faster analysis.
10. Drill down into the analysis to any specific point of sale, individual customer, or receipt.
You receive real-time information directly from the source, objectively assess how well the retail chain is performing overall, and determine whether to stick with the chosen strategy or adjust it.
Structure of the “Receipt Analysis and Loyalty Programs” Application
The dashboard featuring LFL analysis includes a breakdown of all receipts and their structure, payment details, conversion rates, bonus account information, RFM segmentation, customer cohorts, and clusters of retail locations, products, and customers.
Analyzing the loyalty program and the average check provides up-to-date data on key metrics:
- Sales — data for the selected period, displayed as a table or graph — clearly and visually. Here, you can also evaluate the results of promotions and sales, view product popularity rankings, forecast the performance of a planned loyalty program, and more.
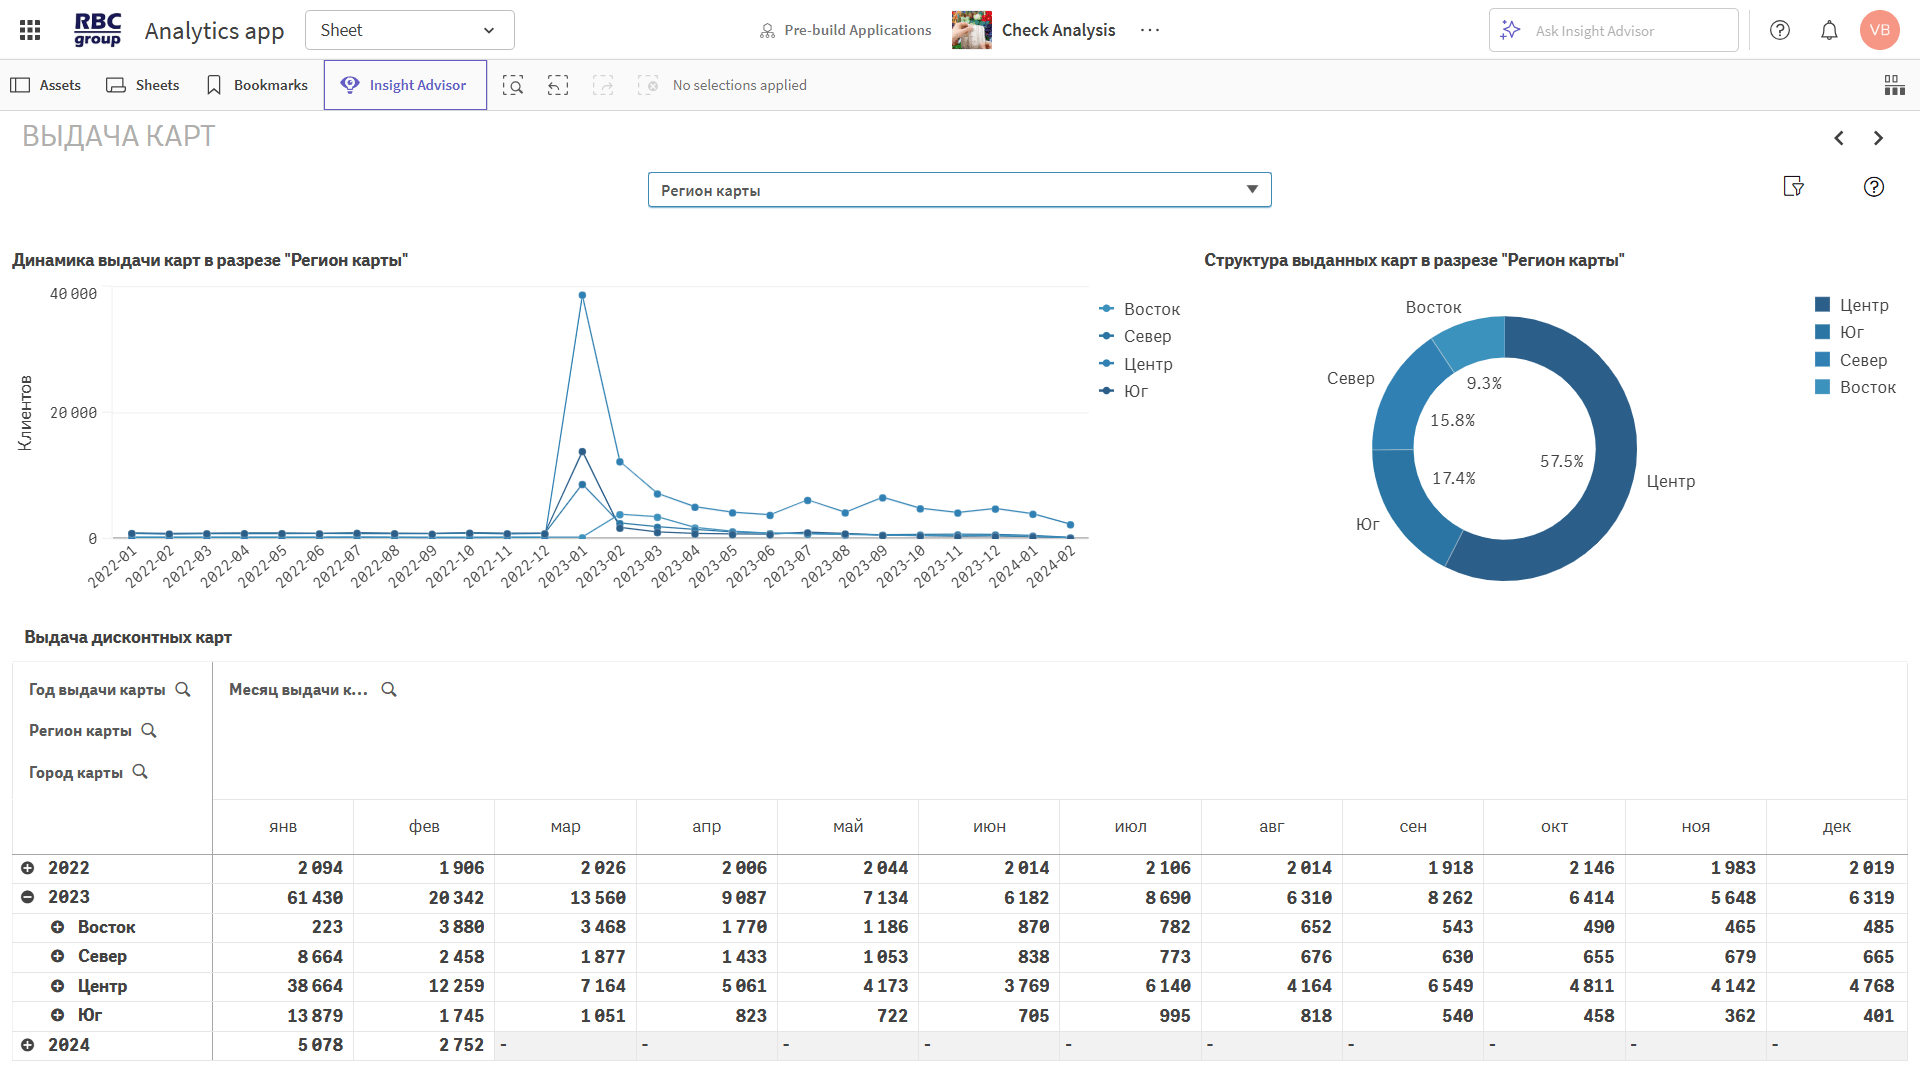
- Customer Bonuses — data on visitors and bonus activity. For example, you can view the total number of bonuses for a specific period, the number of bonuses accrued and redeemed over a certain time frame, and more.
- Audience segmentation — customer base data. This takes into account not only the number of customers but also receipts and sales amounts across various dimensions.
- Receipt analysis — cohort RFM analysis of the database with automatic clustering of products, sales channels, and customers.
- Cohort analysis — data organized by buyer groups, which can be flexibly customized to suit the analysis objectives. For example, forming a cohort of those who received a card after a specified date and not before. Or during the period from one date to another.
One of the main advantages of our solution is its versatility. RBC Group’s receipt analysis and loyalty program system is suitable for both small chains with just a few retail locations and large conglomerates with thousands or even tens of thousands of locations. What’s more, you can start using the pre-configured solution without any prior training or preparation—the system is intuitive and easy to understand, even for those with little experience. And if you encounter any difficulties or have additional questions about how to use it, RBC Group managers are available to provide any assistance you need.
To learn more about the features and tools for analyzing average check size and loyalty programs, please submit a request on our website—we’ll be in touch shortly. And to experience all the benefits of the RBC Group solution firsthand, we recommend requesting demo access to see the real-world benefits it can bring to your business.

