


Visit Analysis: Azerbaijan
The app enables real-time geolocation analysis of distributor employees' visits to retail locations and monitors the effectiveness of point-of-sale equipment in Azerbaijan


To what extent does the sales team adhere to the schedule for their visits?

Which sales agents consistently meet or fail to meet their quotas?

In which regions are there delays in visits, sales, or equipment inspections?

What percentage of orders are placed directly at the store, and how many are placed remotely?

Which equipment has been inspected, and where were the malfunctions detected?

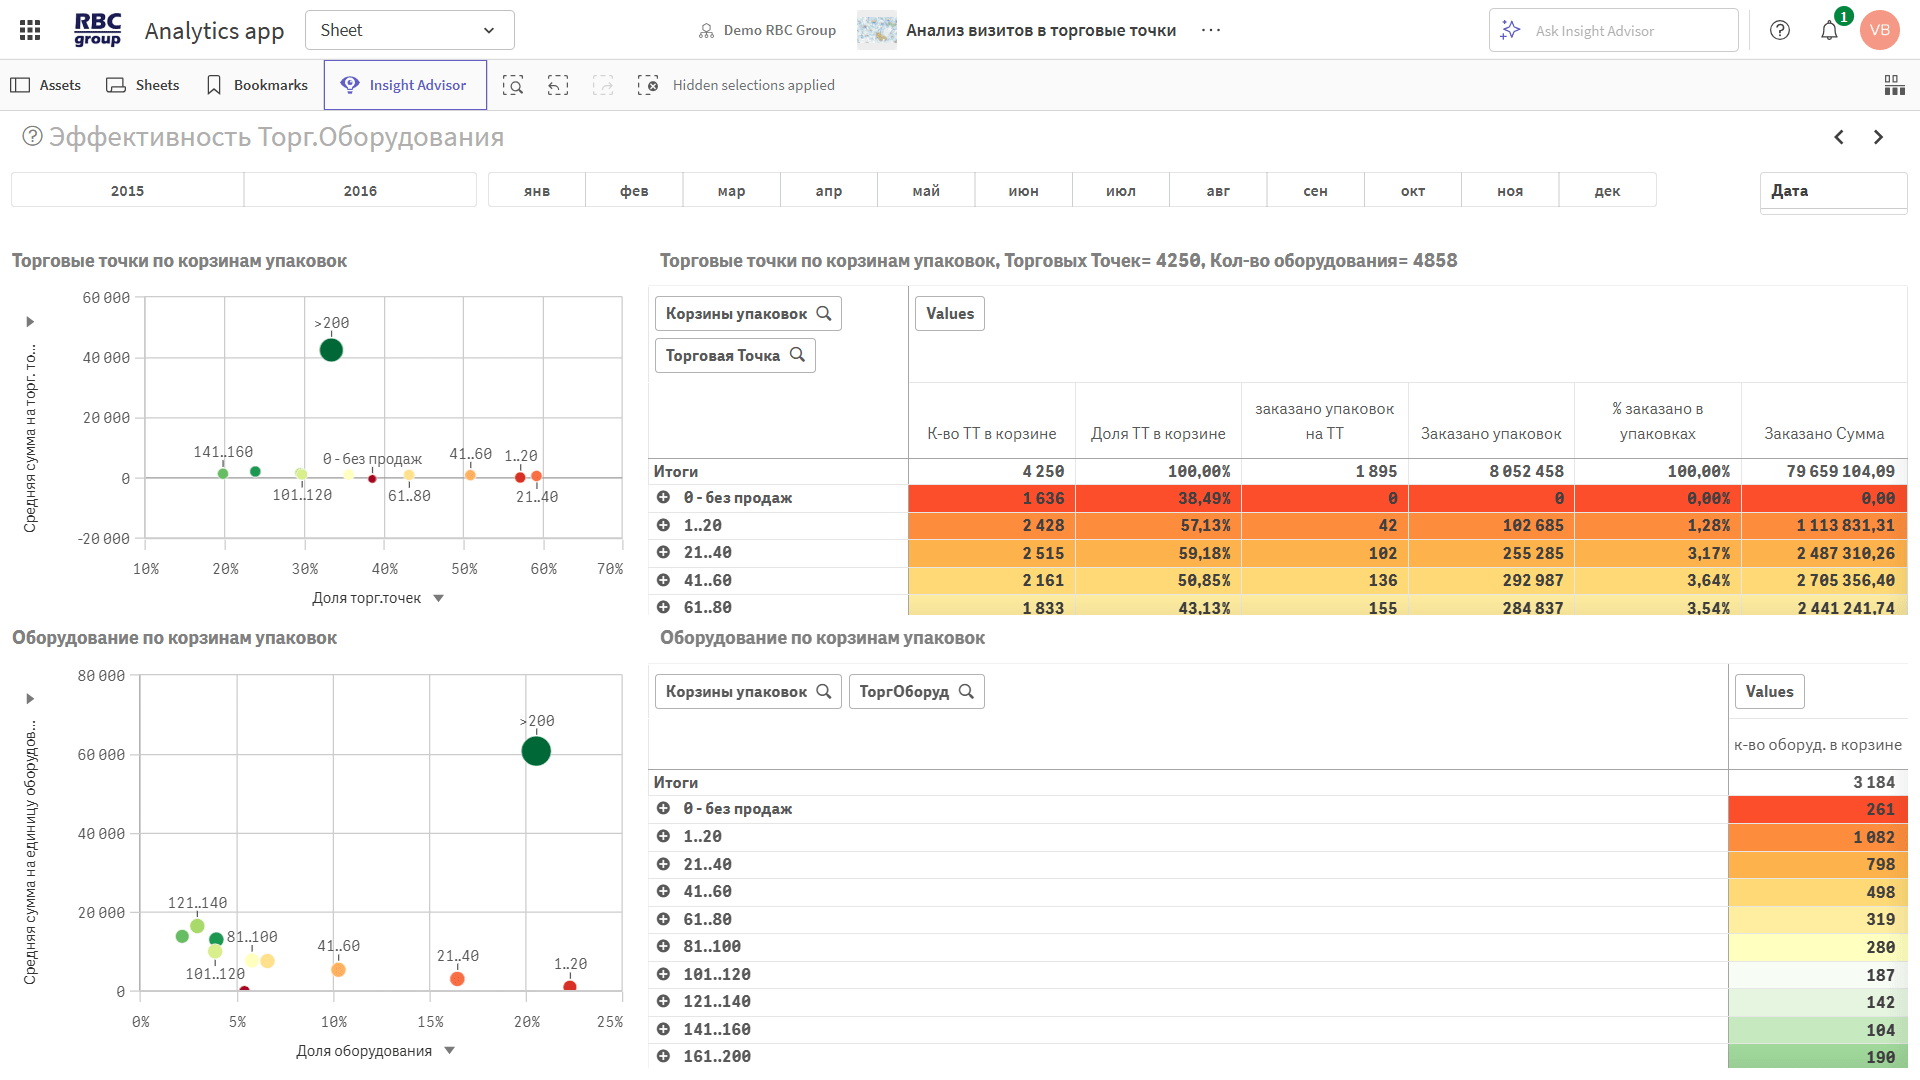
How effective is point-of-sale equipment?

Which points show a consistent sales pattern, and which ones are outliers?

Which employees, teams, or departments are performing the best and the worst?
What percentage of visits result in no purchase?

Which retail locations are seeing a decline in sales despite stable foot traffic?
What are the causes of route deviations and how do they affect KPIs?

What are the metrics for repeat visits, and how effective are they?

This preconfigured solution enables you to perform plan-vs-actual analysis of store visits, the number of point-of-sale equipment inspections, sales volume and revenue, as well as geolocation analysis of store visits based on GPS coordinates
They evaluate adherence to the visit schedule and sales volume within the route.
◾ Number of visits: plan, actual, % completion
◾ Date-to-date visits: absolute and relative values
◾ Sales by quantity and amount: plan, actual, % completion
◾ Equipment scanning: plan, actual, % completion
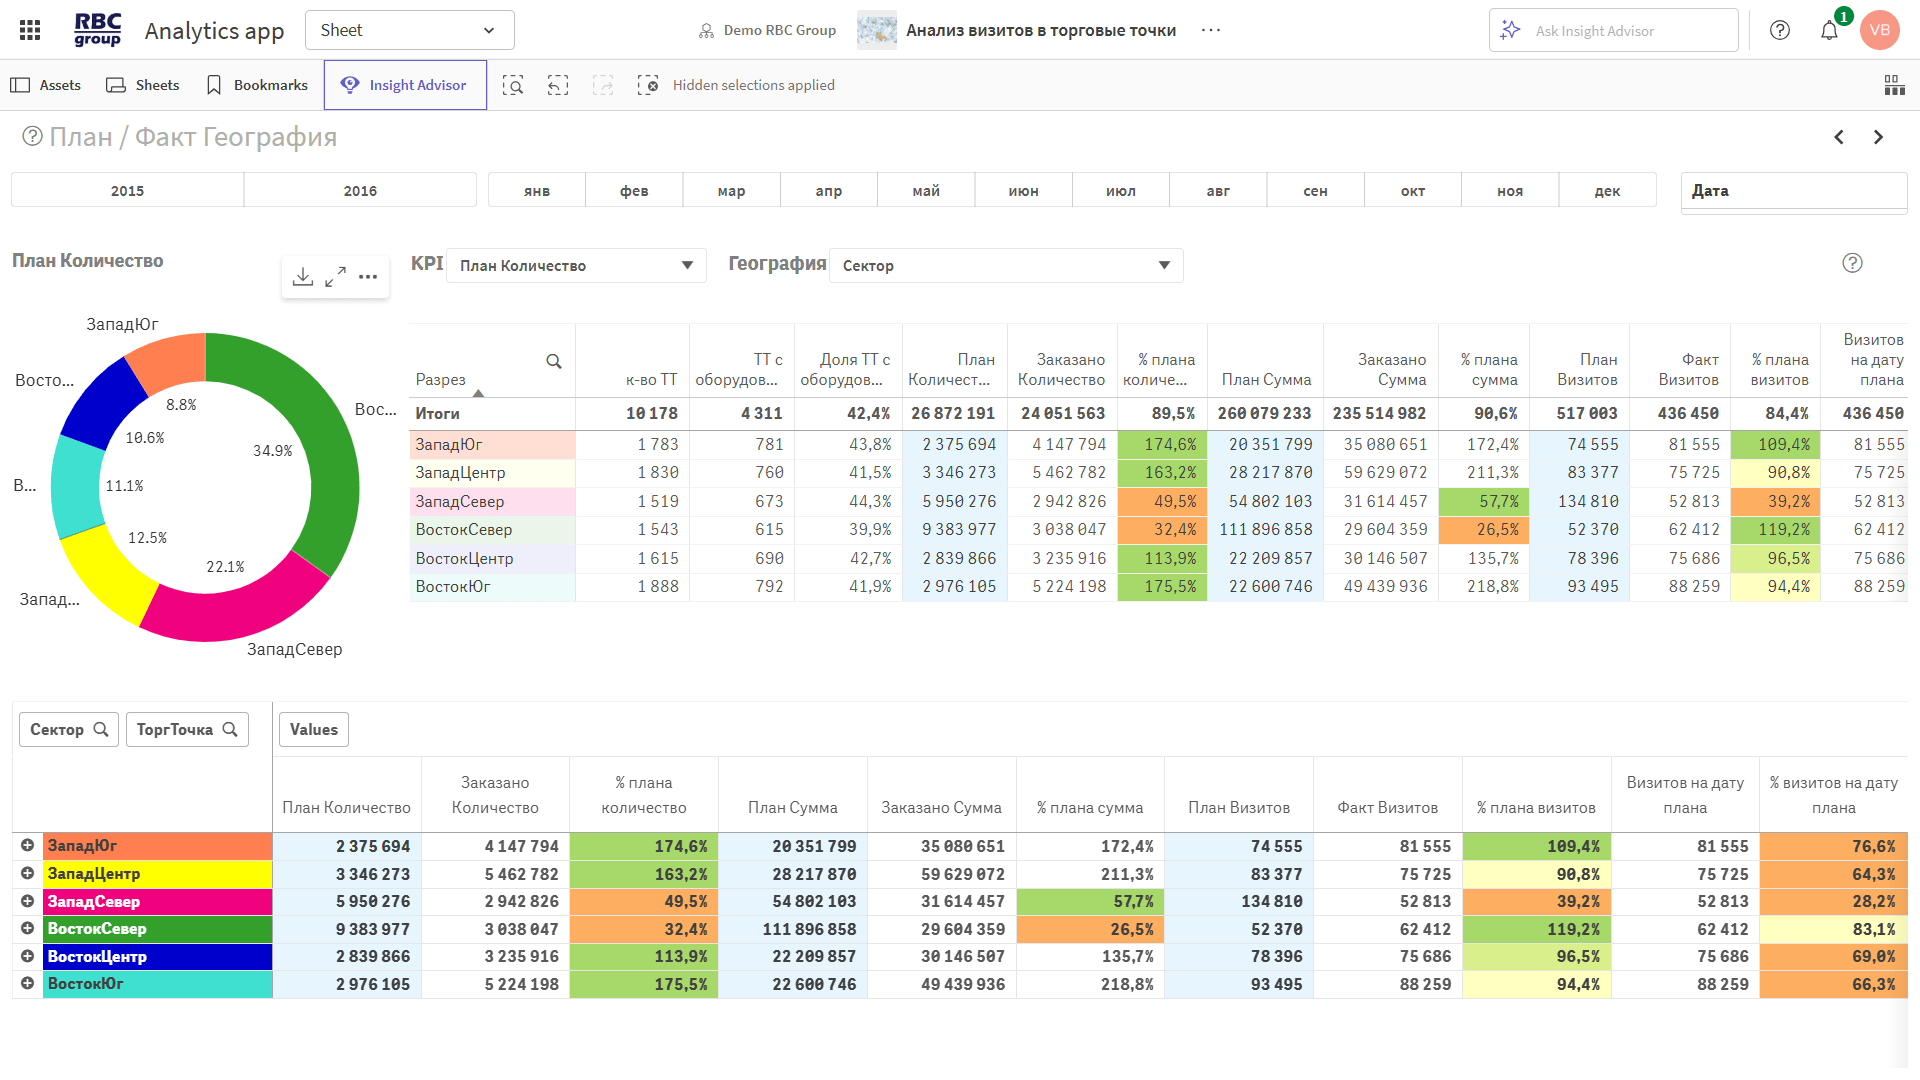
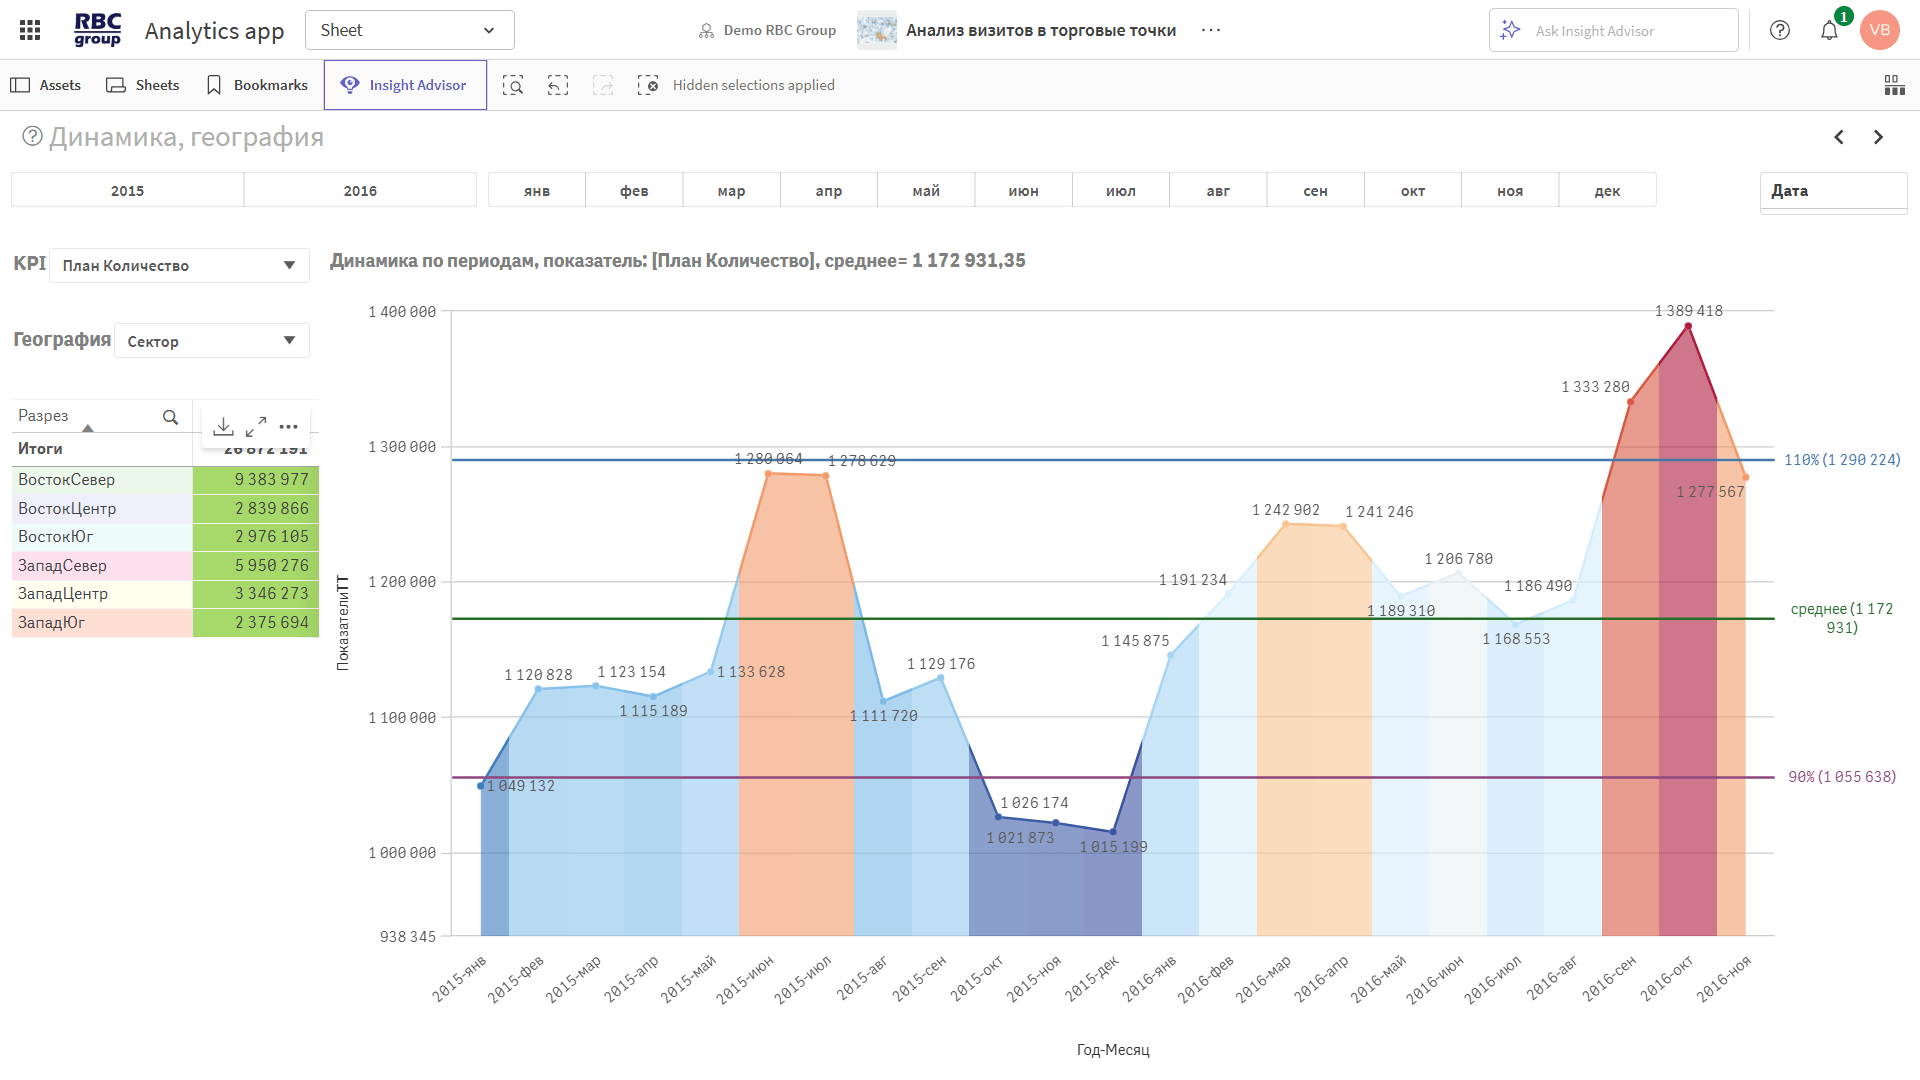
Allow you to analyze KPI performance by region, employee, and location.
◾ KPI performance trends by month, week, and day
◾ Location geotagging, GPS deviations, coverage map
◾ Performance comparison by region, sector, and agent
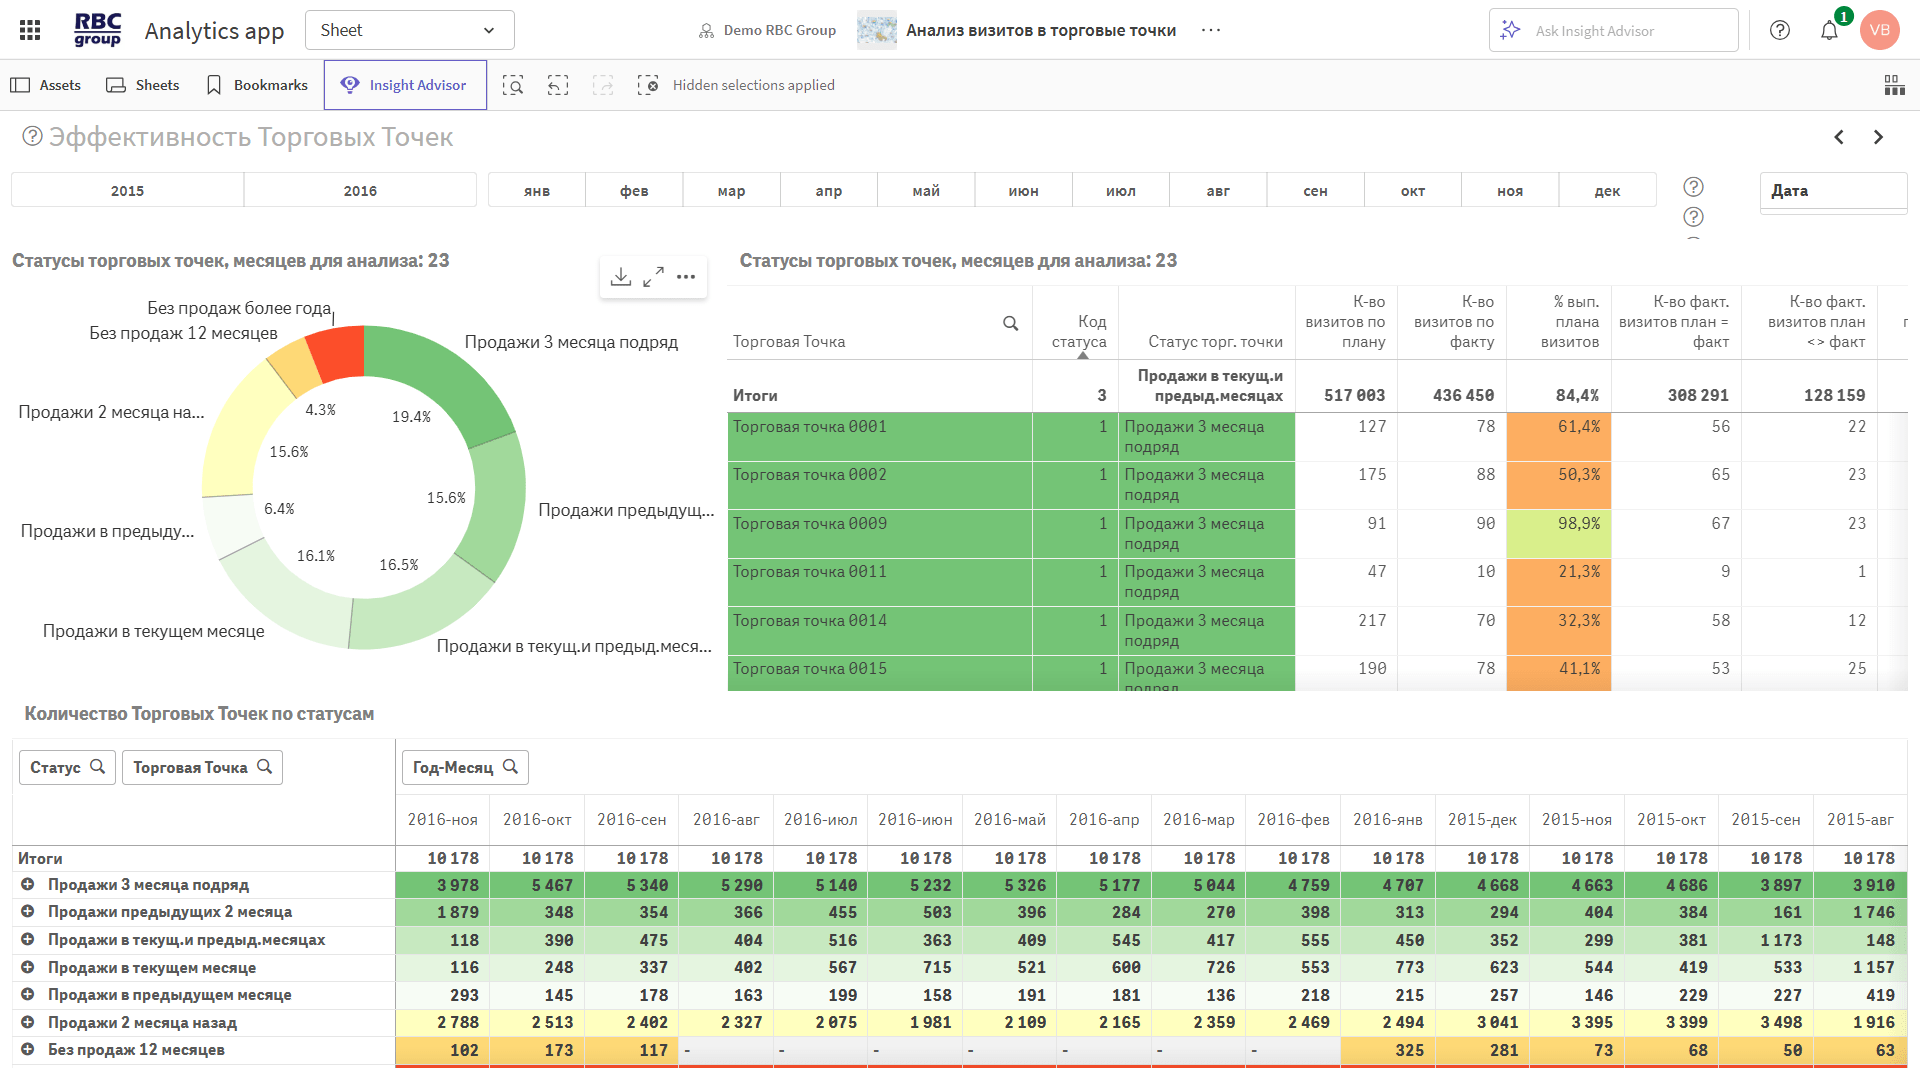
Evaluate the performance of employees, locations, and product categories.
◾ Top 20 agents and locations by performance/underperformance
◾ Location performance by sales consistency
◾ Sales baskets: breakdown by location and equipment
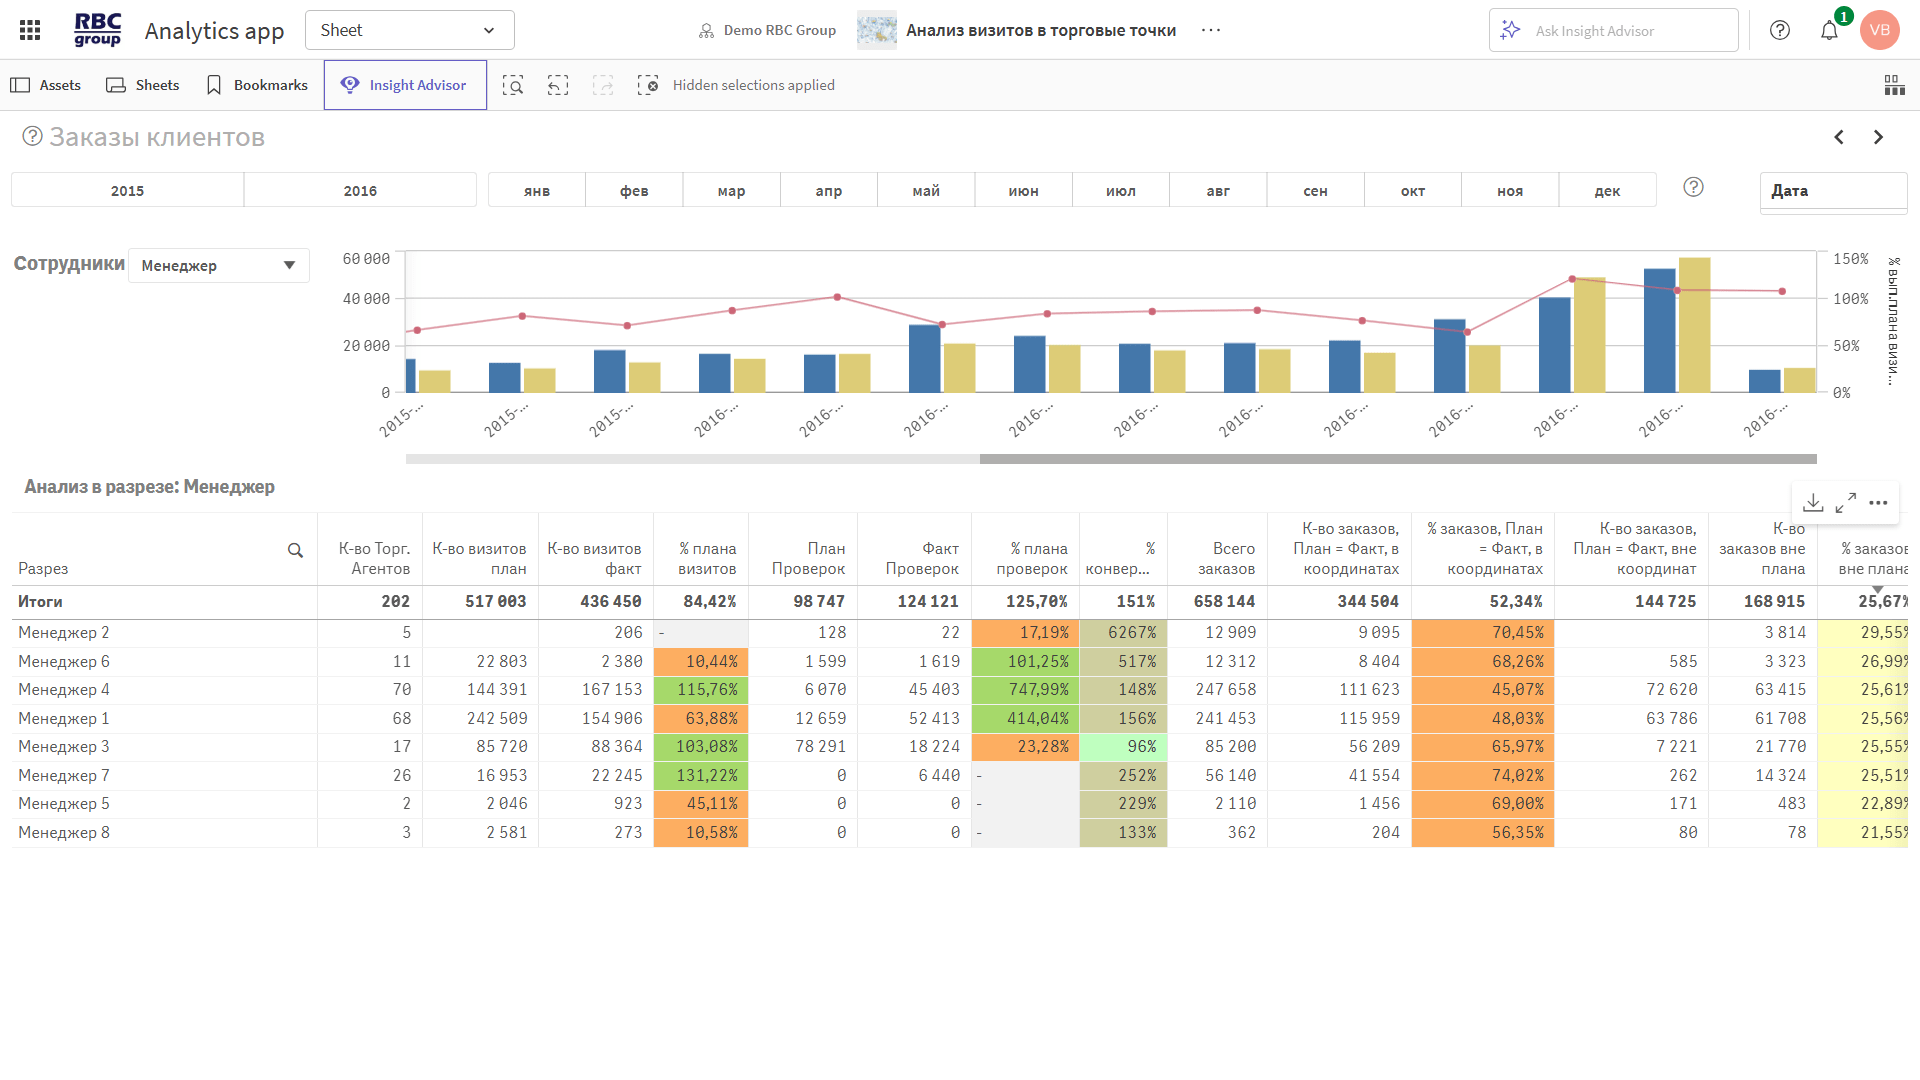
Track violations, route deviations, and visit effectiveness.
◾ Number of orders in scheduled and unscheduled zones
◾ Orders by location with matching dates and coordinates
◾ Percentage of sales deviating from the plan
They assess the impact of equipment on sales and record malfunctions.
◾ Number of checks and % of malfunctions
◾ Sales by equipment category
◾ Comparison of locations with and without equipment
Our BI solution consolidates data on visits, GPS locations, orders, equipment, and inspections. You get a single dashboard for real-time monitoring, accessible via a web browser and mobile devices.
Compare planned vs. actual figures for visits, sales, and inspections. Use interactive maps and GPS reports to identify discrepancies and fictitious visits.
Analyze sales patterns, equipment efficiency, reasons for uncompleted visits, and the percentage of unplanned orders — to boost productivity and increase orders.


RBC Group enhances its clients' competitiveness by implementing modern business analytics, data integration and management, artificial intelligence, and advanced analytics systems.


 26
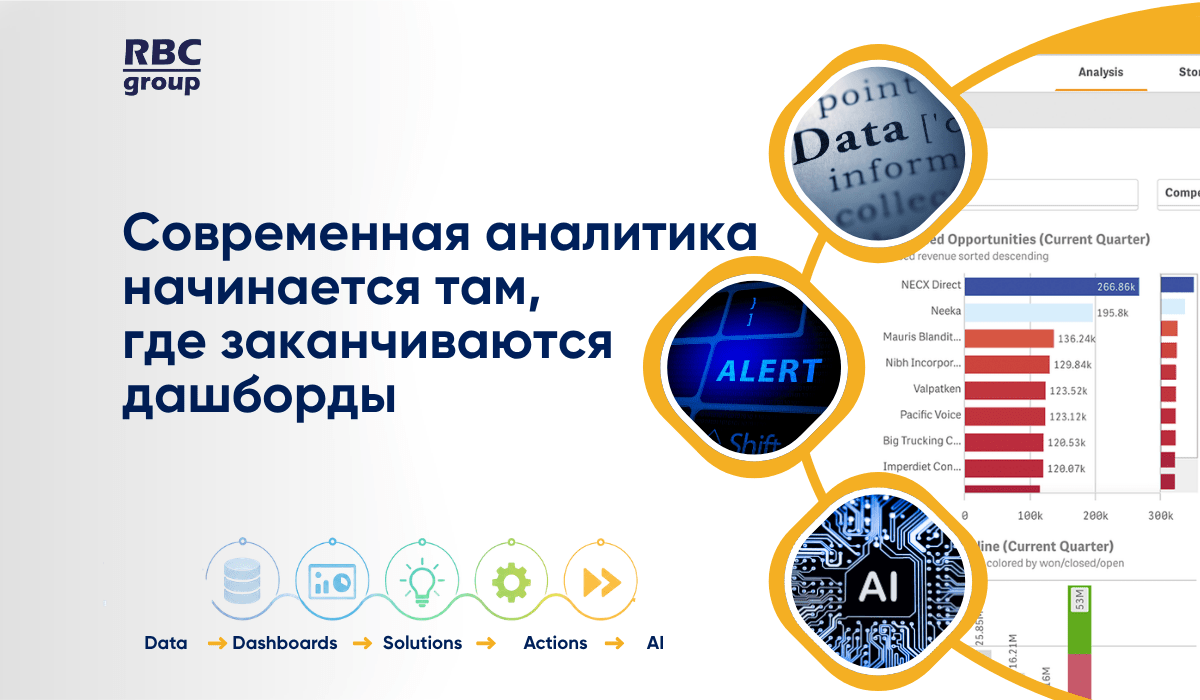
26Современная аналитика — это уже не просто дашборды. Рассказываем, почему бизнесу недостаточно видеть данные и как современные BI-платформы помогают быстрее принимать решения, автоматизировать действия и использовать возможности ИИ.
 35
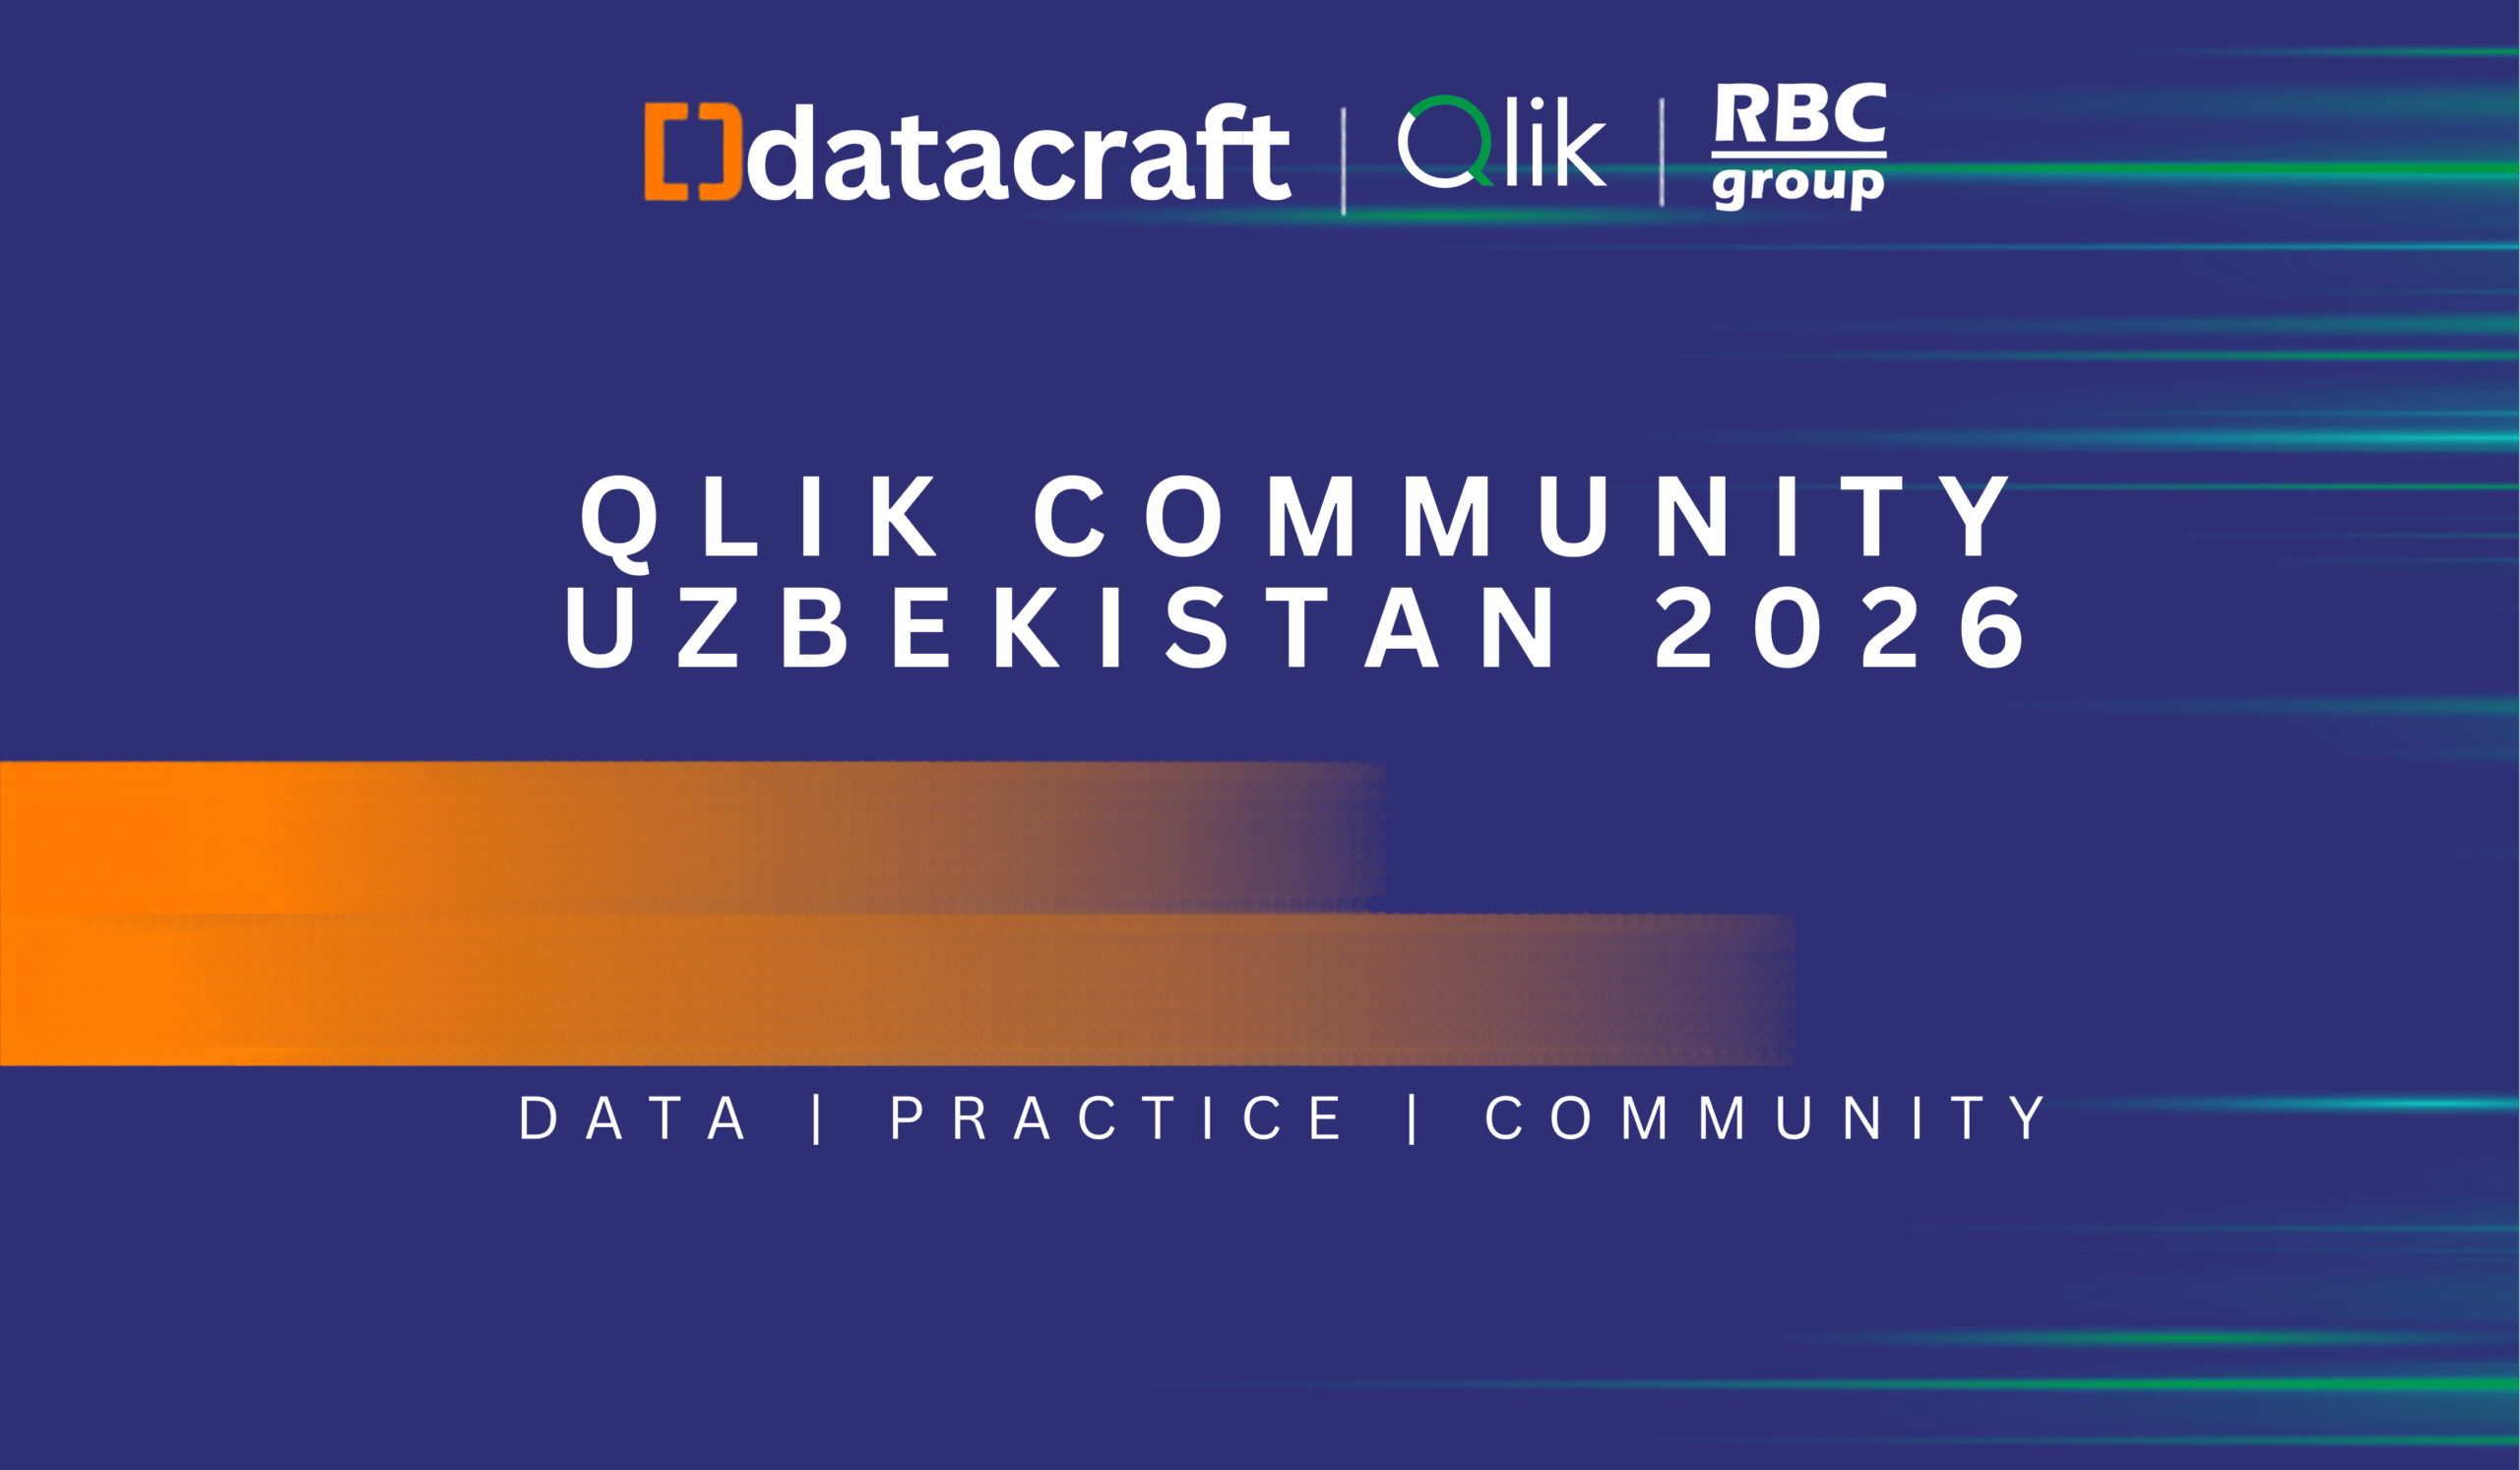
35Qlik сегодня — это уже не просто BI. На Qlik Community Uzbekistan 2026 участники обсудили будущее аналитики, облачные технологии, интеграцию данных и возможности Agentic AI. Делимся ключевыми выводами и инсайтами мероприятия.
 16
16Почему высокая активность торговых представителей не всегда означает эффективную работу на территории? Рассмотрим ключевые показатели, практические сценарии и подход к управлению торговыми визитами на основе данных.
26Современная аналитика — это уже не просто дашборды. Рассказываем, почему бизнесу недостаточно видеть данные и как современные BI-платформы помогают быстрее принимать решения, автоматизировать действия и использовать возможности ИИ.
35Qlik сегодня — это уже не просто BI. На Qlik Community Uzbekistan 2026 участники обсудили будущее аналитики, облачные технологии, интеграцию данных и возможности Agentic AI. Делимся ключевыми выводами и инсайтами мероприятия.
16Почему высокая активность торговых представителей не всегда означает эффективную работу на территории? Рассмотрим ключевые показатели, практические сценарии и подход к управлению торговыми визитами на основе данных.
Warning: foreach() argument must be of type array|object, false given in /home/rbcgrp/rbcgrp.com/www/wp-content/themes/theme-sp/template/blog.php on line 374


