


Analysis of Azerbaijan's Reserves
The app allows you to monitor excess inventory, minimize slow-moving stock, reduce lost sales due to shortages of fast-moving items, and accelerate inventory turnover in Azerbaijan


What are our current stock levels, and how are they changing?

Which supplies are in surplus, and which are in short supply?

Why aren't there any sales even though there is stock available?

In which warehouses are the frozen surplus items located, and why?

How do reserves change over time? Where do seasonal fluctuations occur?

How evenly is the product range distributed across the locations?

How has inventory turnover changed over the past period?

Where are we losing sales due to product shortages?

What is the demand forecast for the coming period, and are current inventory levels sufficient?

Which items need to be restocked?

Is the retail location meeting its product assortment targets?

How can we reallocate inventory across the network, taking into account sales forecasts and current stock levels?
a BI platform


The preconfigured "Inventory Analysis" solution enables you to perform KPI, dynamic, share-based, multidimensional, comparative, geographic, ranking, LFL, ABC, XYZ, FMR, and transactional inventory analysis for a company or group of companies. Analyze inventory 360° across all dimensions: SKU, category, group, subgroup, brand, assortment matrix, storage locations (country, region, city, warehouse, store), manufacturer, and supplier.
The preconfigured "Inventory Analysis" solution on the Power BI BI platform enables KPI analysis, as well as dynamic, share-based, multidimensional, comparative, geographic, ranking, LFL, ABC, XYZ, FMR, and transactional analysis of a company’s or group of companies’ inventory. The solution enables 360° inventory analysis across all dimensions: SKU, category, group, subgroup, brand, product mix, storage locations (country, region, city, warehouse, store), manufacturer, and supplier.
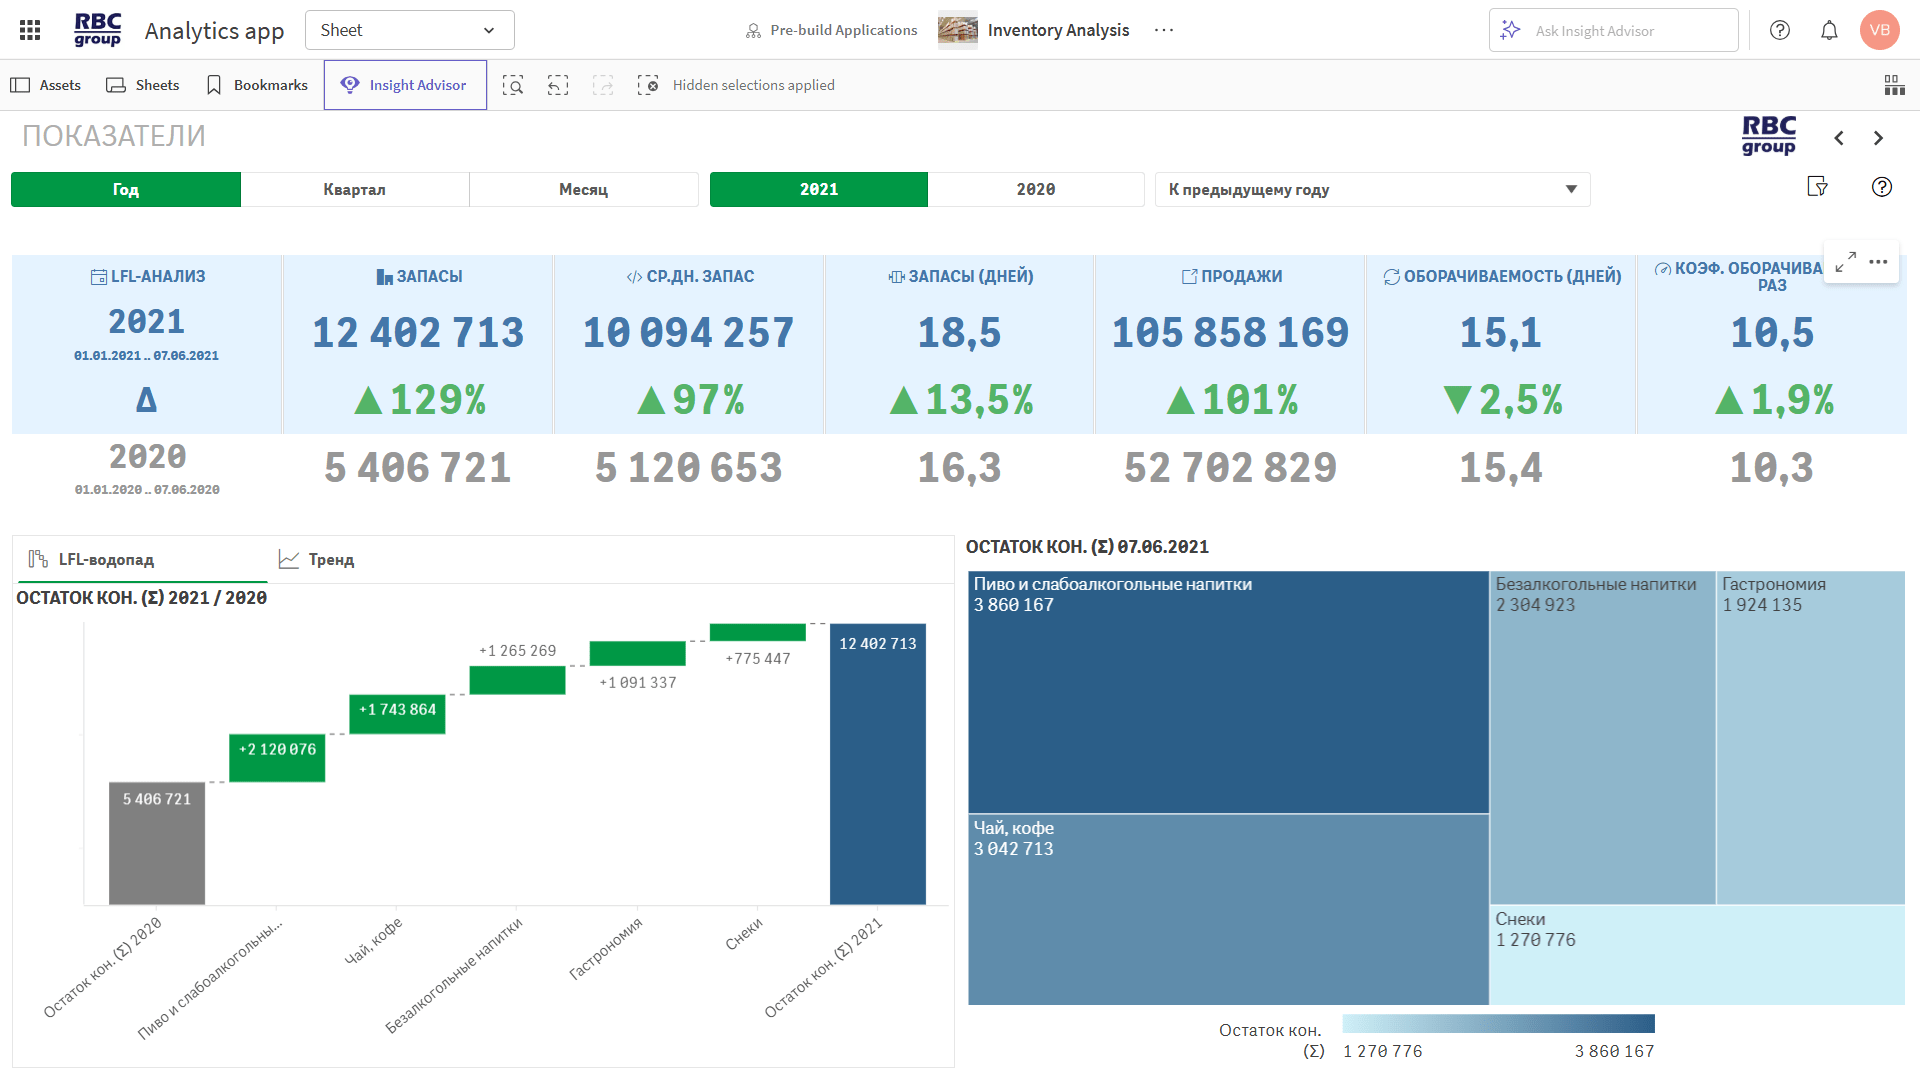
They show the total amount and the stability of the balances.
◾ Opening/closing balance (amount and quantity) — total volume by date.
◾ Average daily inventory — reflects the consistency of inventory levels.
◾ Inventory (in days) — how many days the current inventory will last at the current sales rate.
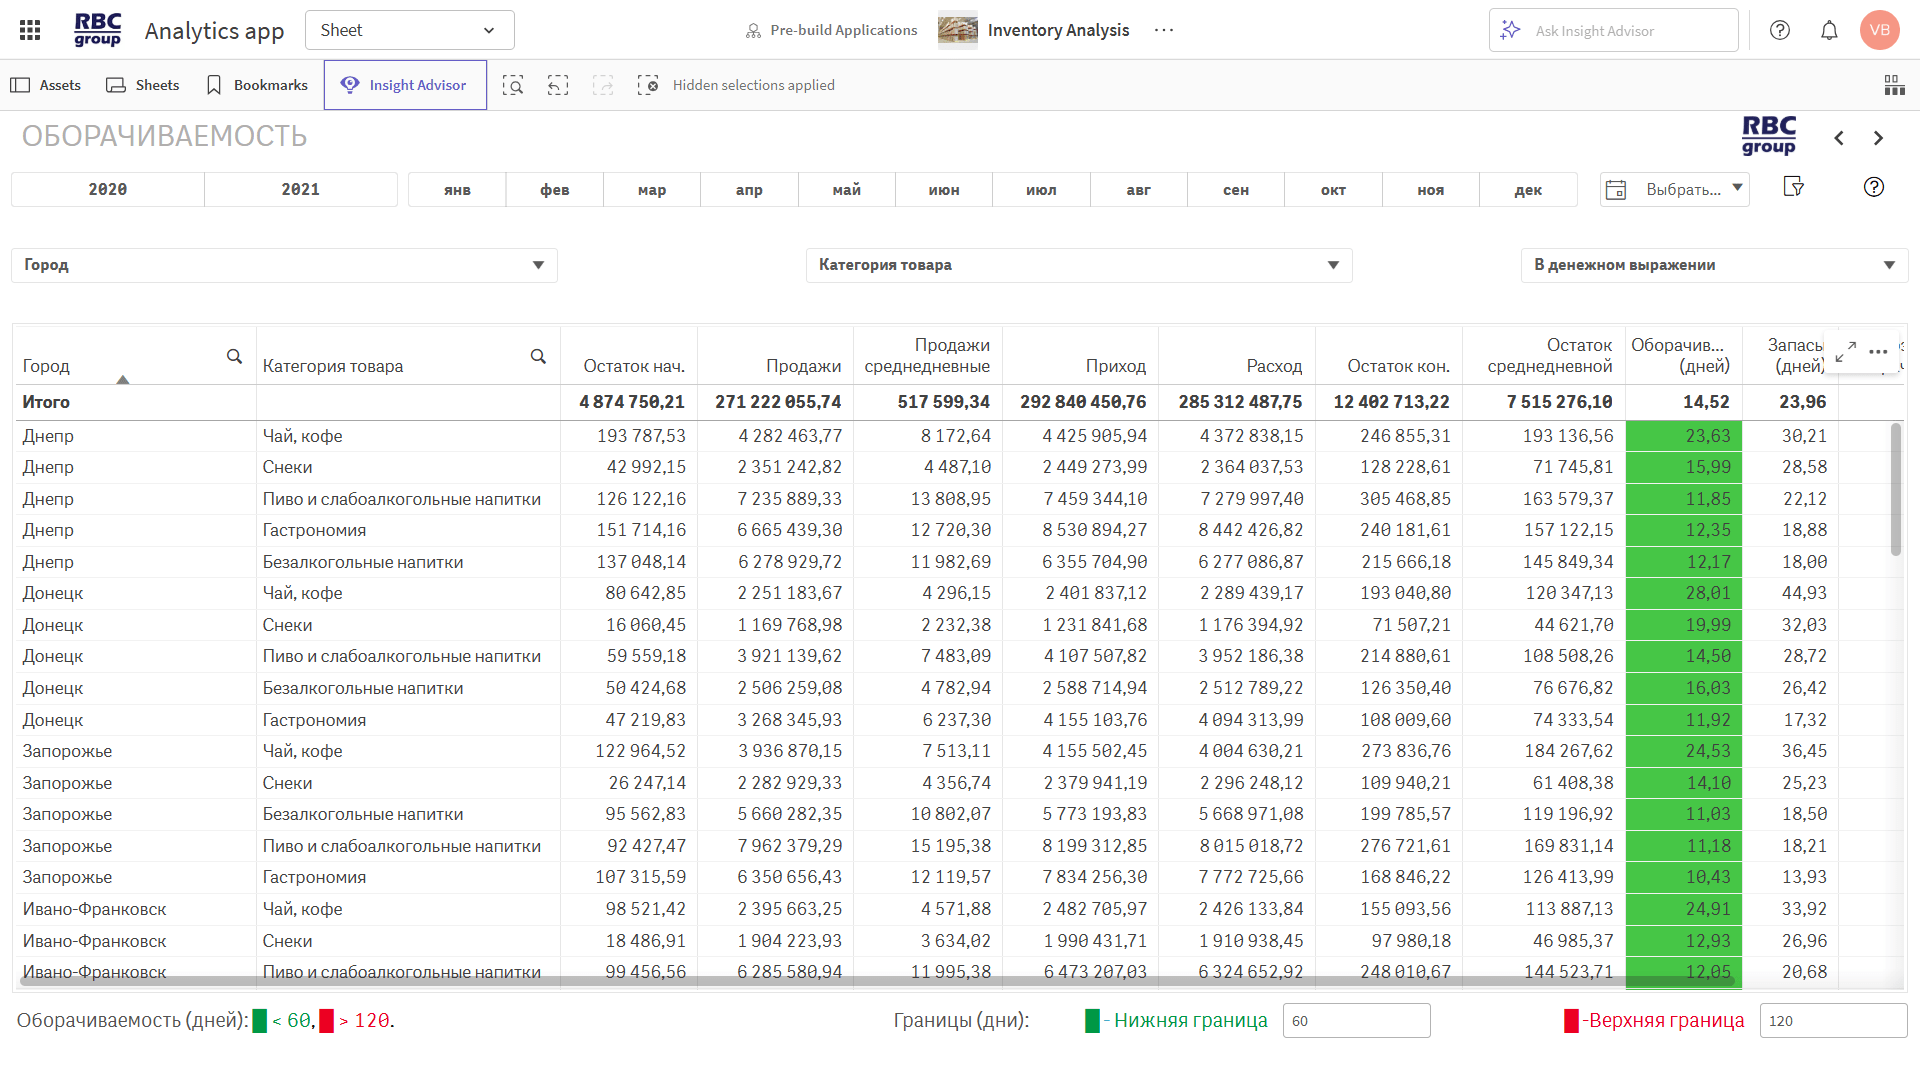
They evaluate the effectiveness of inventory utilization.
◾ Inventory turnover (in days) — the number of days it takes for inventory to be completely replenished.
◾ Inventory turnover ratio — the number of times inventory is turned over during a given period.
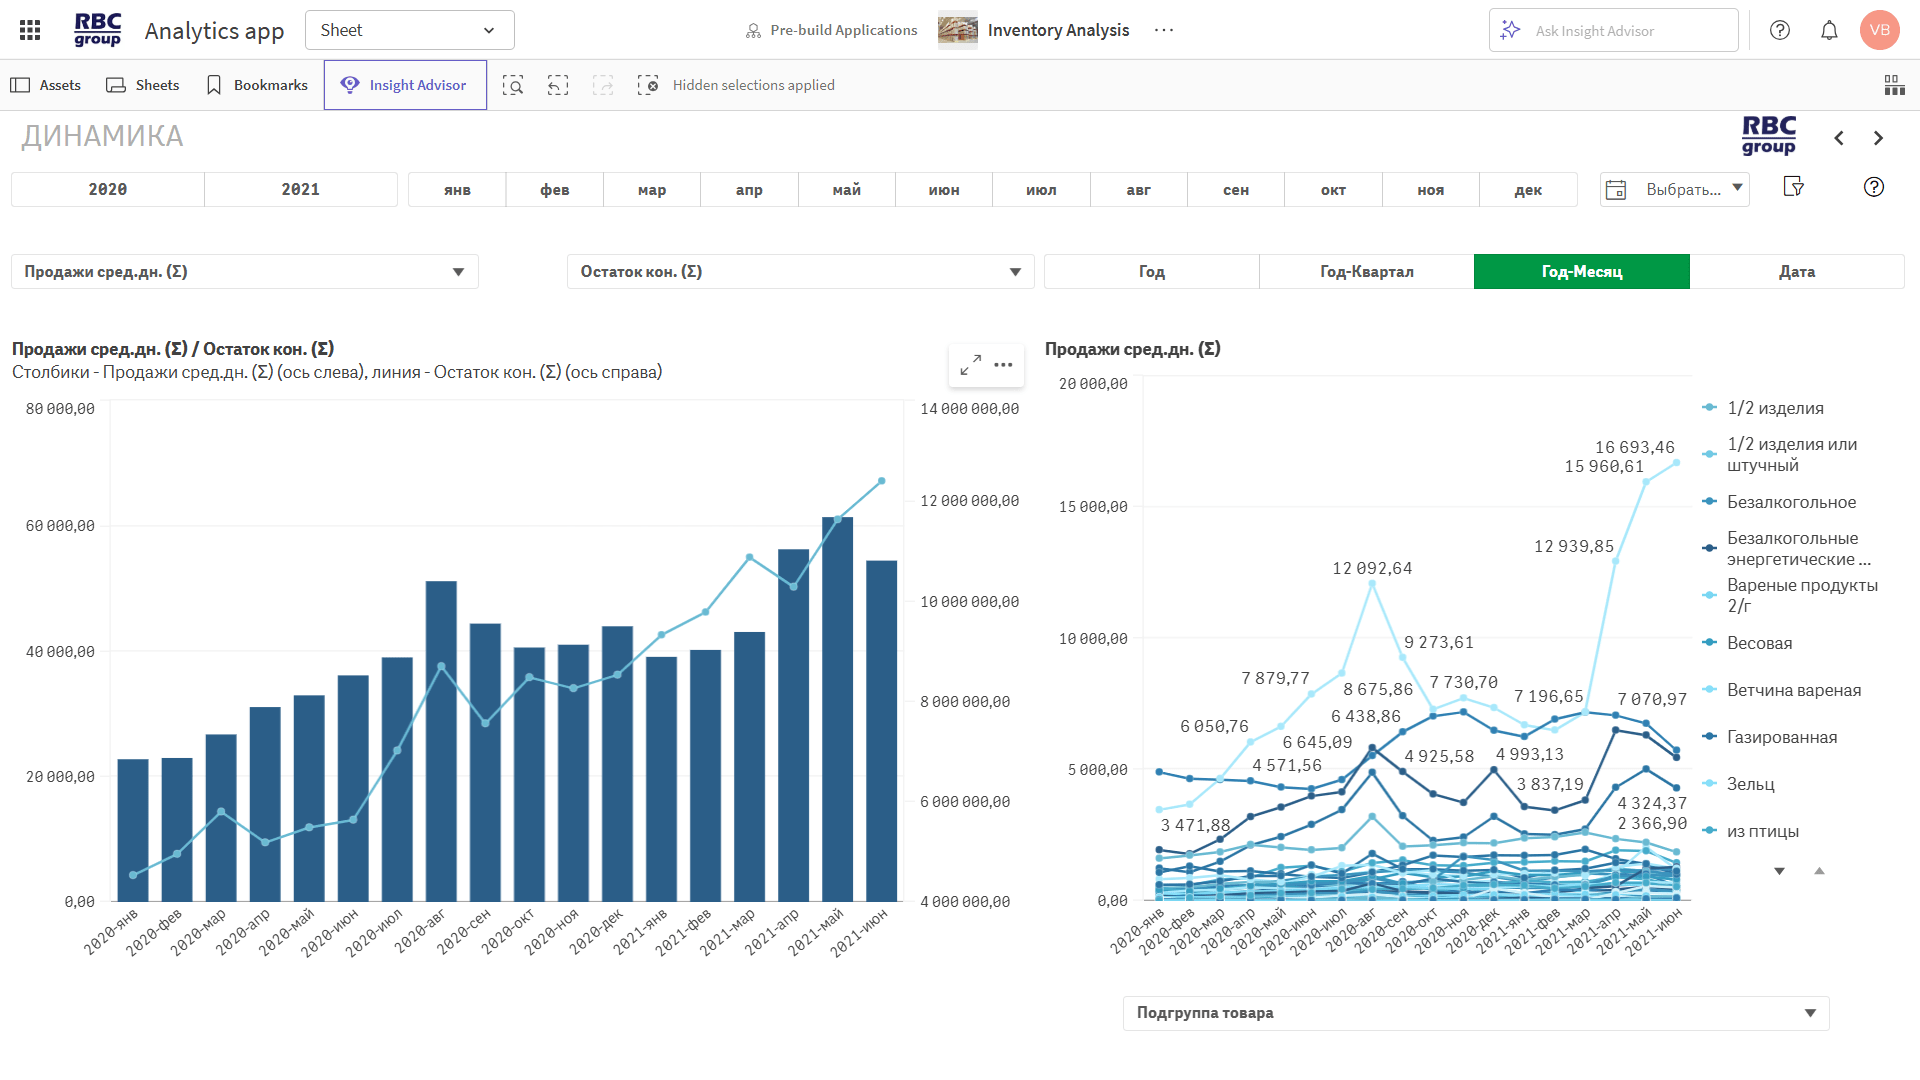
◾ Inventory turnover trends — seasonal and trend-based fluctuations.
These figures reflect the relationship between sales and changes in inventory.
◾ Sales (amount and quantity) — sales volume.
◾ Receipts / Issues — movement of goods in the warehouse.
◾ Average daily sales — the basis for calculating demand and planning.
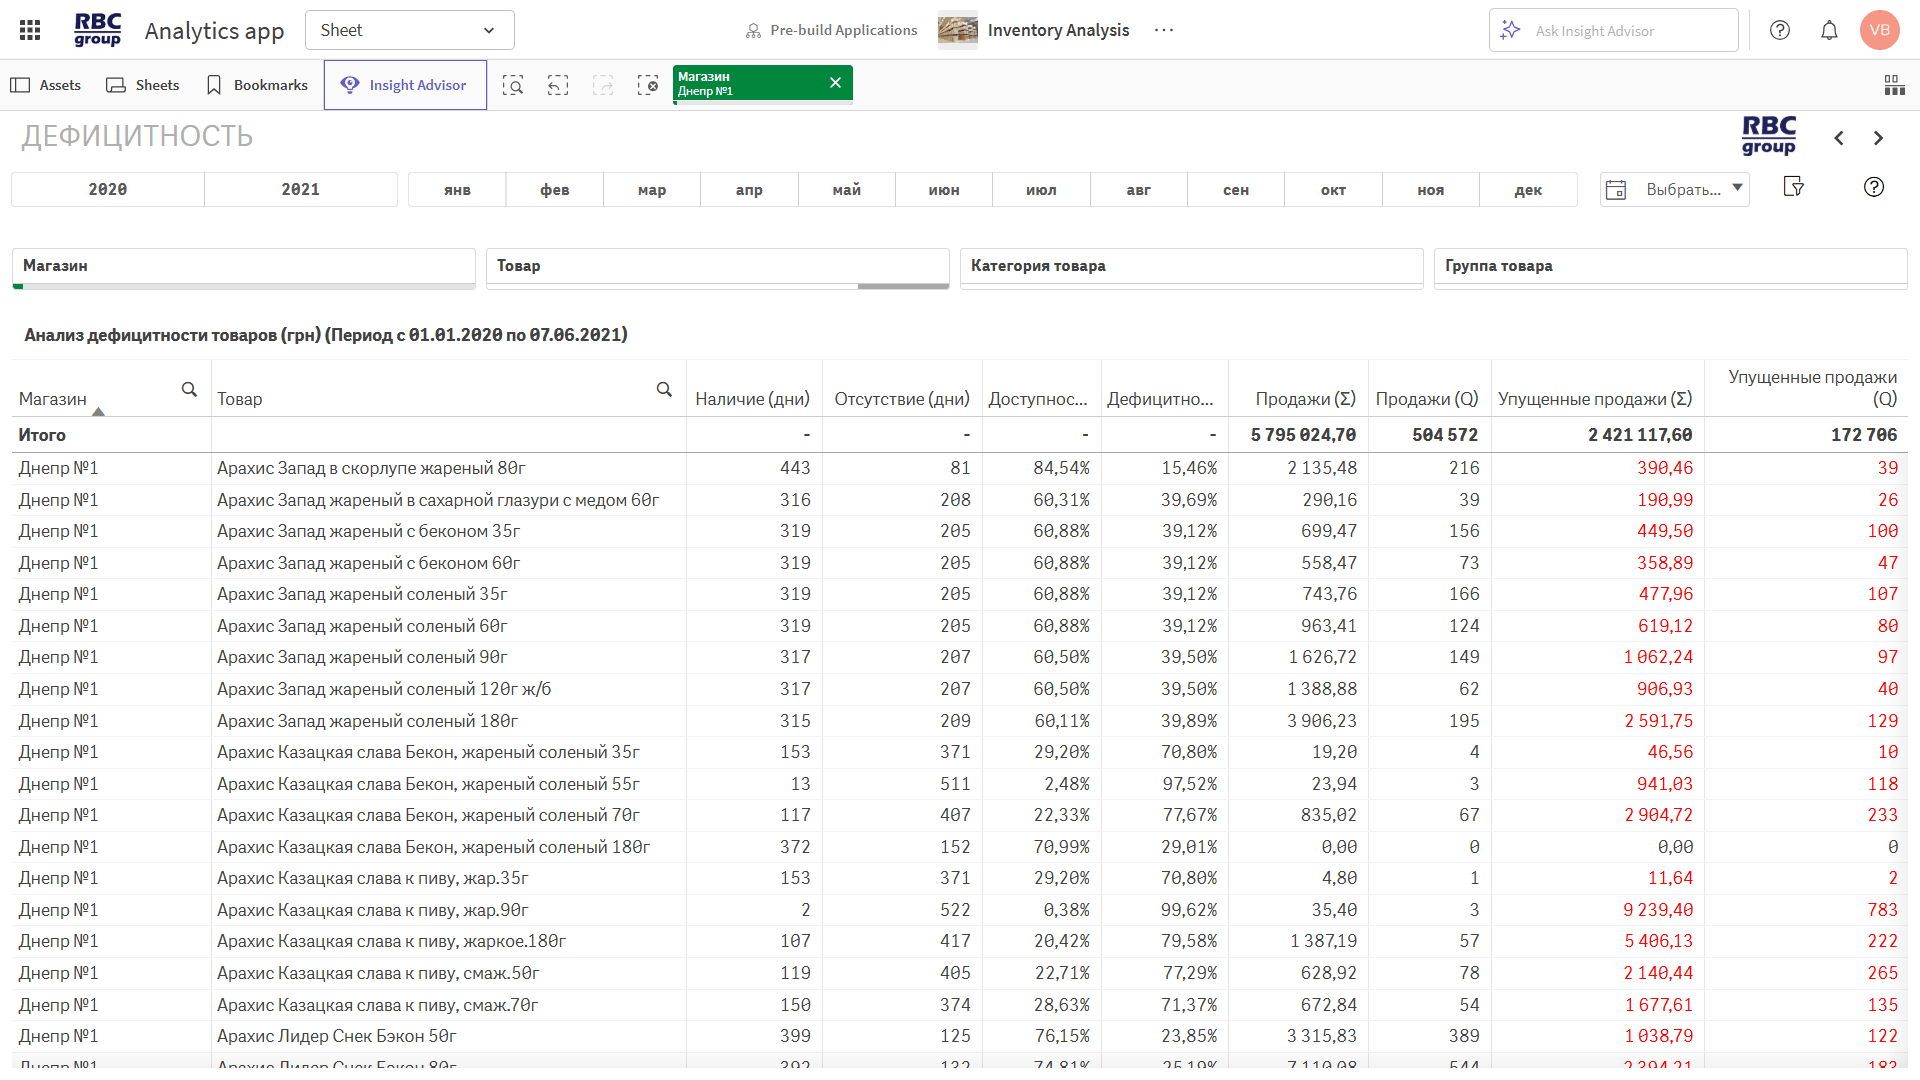
They track losses caused by a lack of inventory at the right time.
◾ Stockout rate, % — the number of days the product was out of stock despite existing demand.
◾ Lost sales — losses in terms of both revenue and quantity.
◾ Availability, % — the percentage of time the product was in stock.
They enable an assessment of the effectiveness of the product portfolio and its presence in retail outlets.
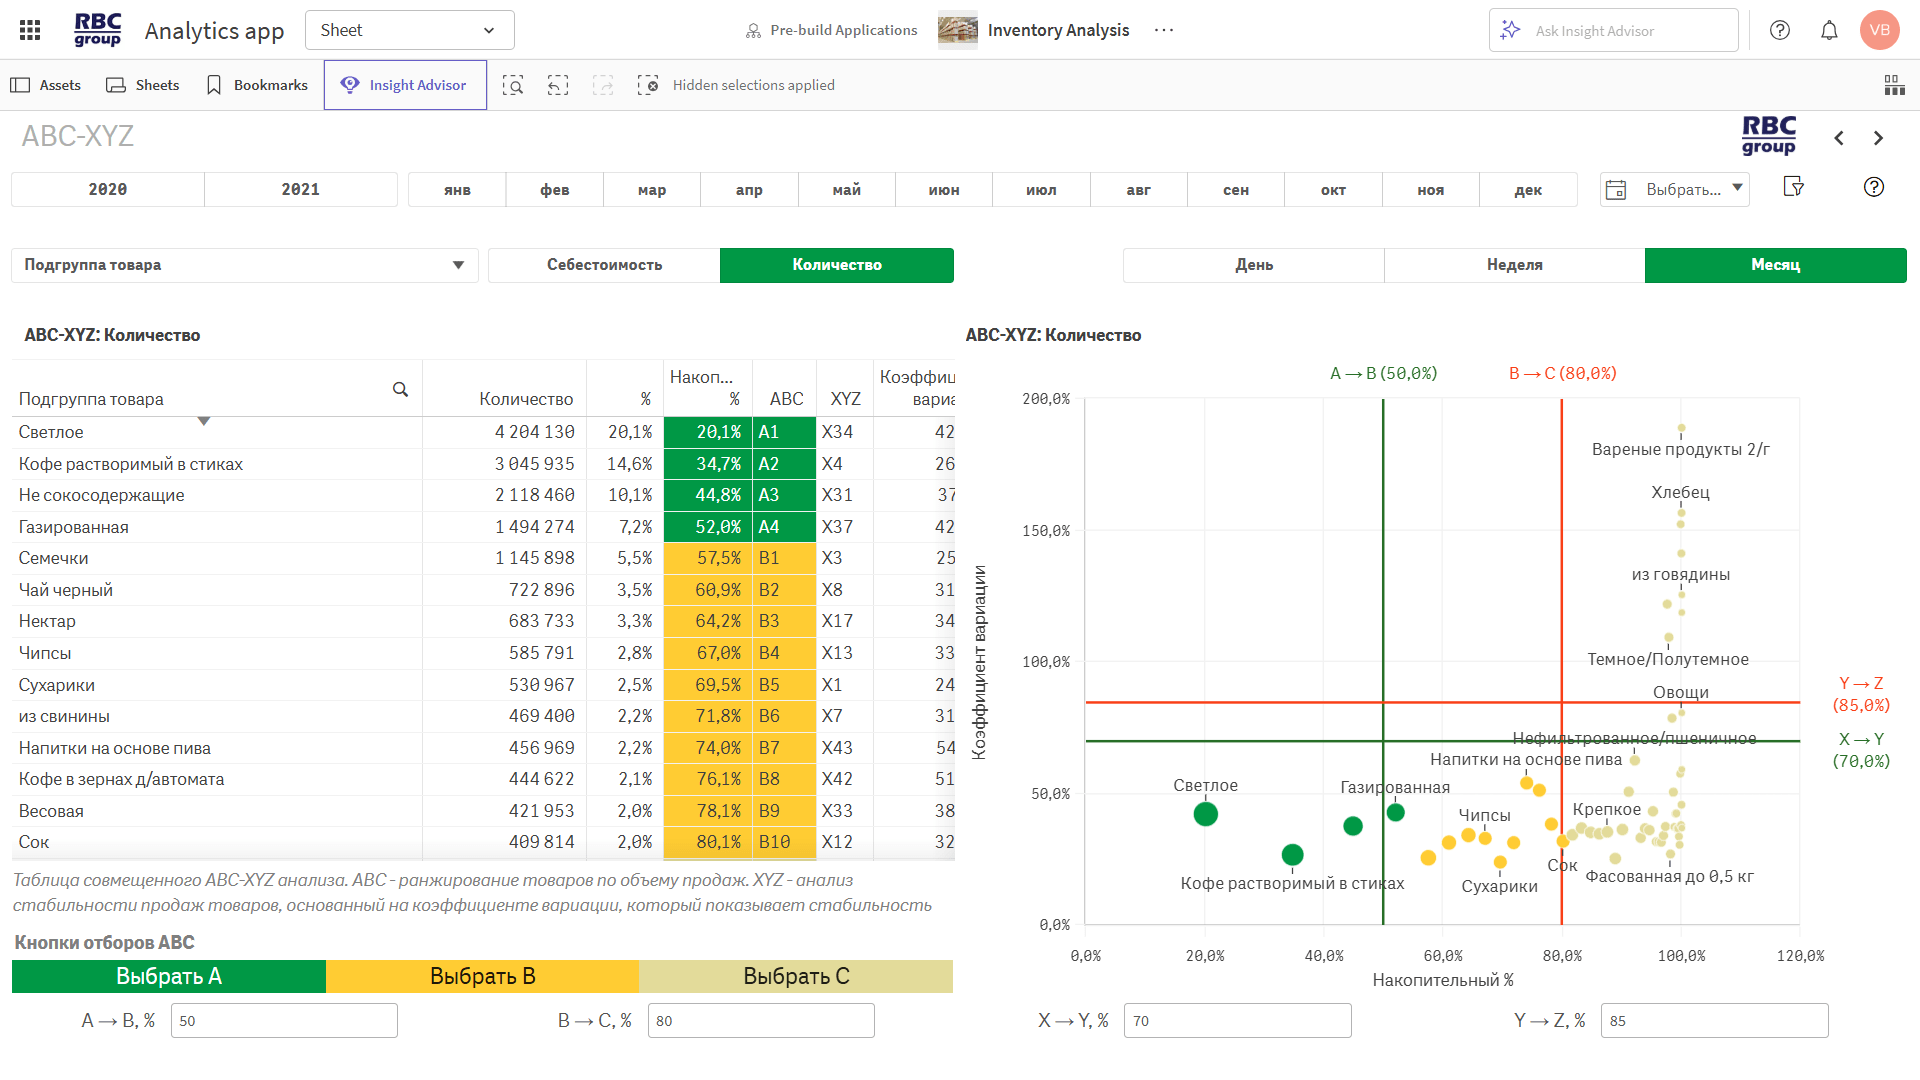
◾ ABC–XYZ classification—based on importance and demand stability.
◾ FMR analysis — evaluation of products based on purchase frequency.
◾ Reassessment of inventory levels — based on sales anomalies.
◾ Representation analysis (quota, actual, variance) — product range coverage by location.
Tools for comparing time periods and assessing the impact of changes.
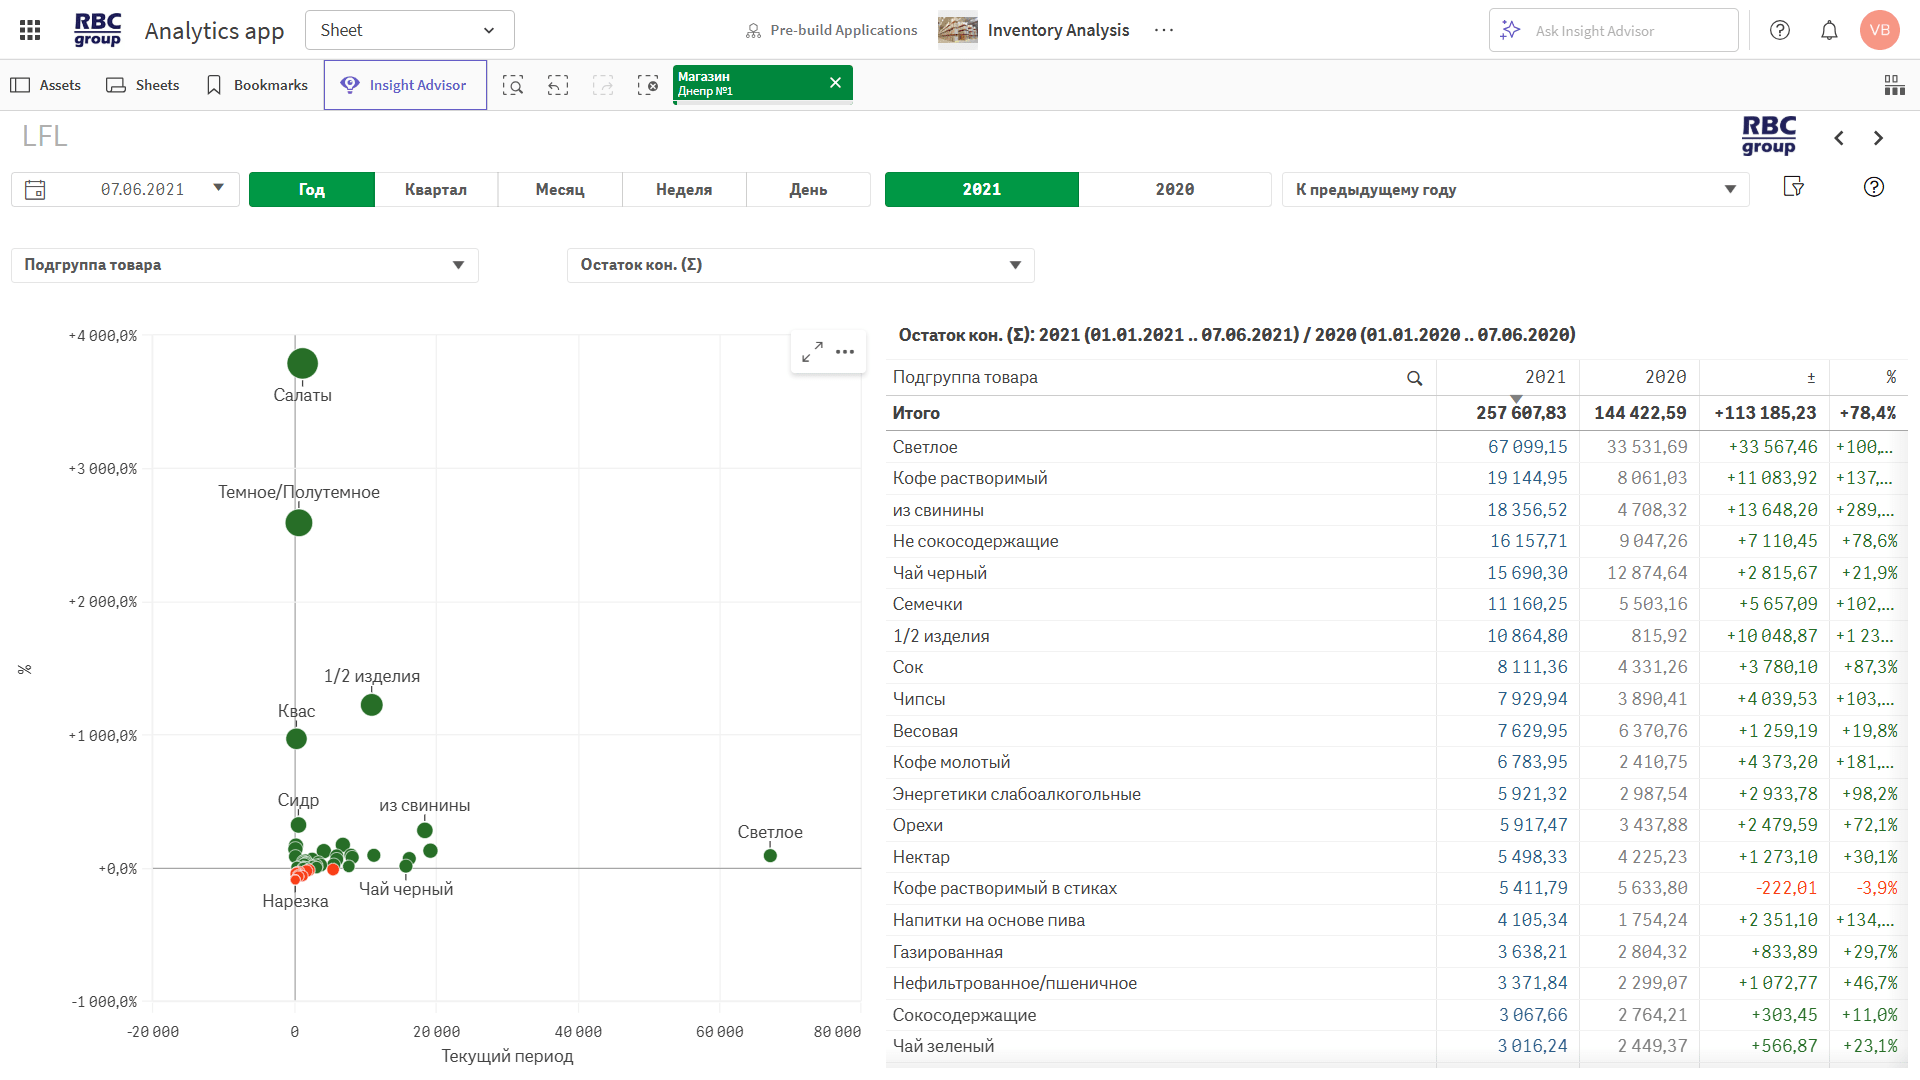
◾ LFL analysis — comparing current performance metrics with those of the same periods in previous years.
◾ What-if analysis — assessing the impact of changes in demand, product mix, or supply terms.

In just 30 minutes, learn how to identify excess and shortage items, analyze inventory turnover, and forecast demand.
We’ll show you a ready-to-use analytical solution with minimal implementation requirements.
We consolidate data from ERP, Excel, and other systems into a single platform accessible from any device.
You get a complete overview of inventory levels, stock structure, and inventory turnover—without manual processing and with just one click.
BI calculates inventory shortages, turnover, and lost sales, and forecasts demand based on historical data.
This helps respond to risks in a timely manner, reduce excess inventory, and avoid losses due to stockouts.
Compare inventory levels across warehouses, stores, and categories. Use ABC, XYZ, FMR, and LFL analysis to assess product representation and performance.
The result is increased sales through a balanced product portfolio and accurate planning.


RBC Group enhances its clients' competitiveness by implementing modern business analytics, data integration and management, artificial intelligence, and advanced analytics systems.


 26
26Современная аналитика — это уже не просто дашборды. Рассказываем, почему бизнесу недостаточно видеть данные и как современные BI-платформы помогают быстрее принимать решения, автоматизировать действия и использовать возможности ИИ.
 35
35Qlik сегодня — это уже не просто BI. На Qlik Community Uzbekistan 2026 участники обсудили будущее аналитики, облачные технологии, интеграцию данных и возможности Agentic AI. Делимся ключевыми выводами и инсайтами мероприятия.
 16
16Почему высокая активность торговых представителей не всегда означает эффективную работу на территории? Рассмотрим ключевые показатели, практические сценарии и подход к управлению торговыми визитами на основе данных.
26Современная аналитика — это уже не просто дашборды. Рассказываем, почему бизнесу недостаточно видеть данные и как современные BI-платформы помогают быстрее принимать решения, автоматизировать действия и использовать возможности ИИ.
35Qlik сегодня — это уже не просто BI. На Qlik Community Uzbekistan 2026 участники обсудили будущее аналитики, облачные технологии, интеграцию данных и возможности Agentic AI. Делимся ключевыми выводами и инсайтами мероприятия.
16Почему высокая активность торговых представителей не всегда означает эффективную работу на территории? Рассмотрим ключевые показатели, практические сценарии и подход к управлению торговыми визитами на основе данных.
Warning: foreach() argument must be of type array|object, false given in /home/rbcgrp/rbcgrp.com/www/wp-content/themes/theme-sp/template/blog.php on line 374

Inventory analysis: We ensure there are no shortages or surpluses of goods in warehouses and retail locations
Inventory refers to the volume of goods, either in physical units or monetary terms. This includes not only goods that are physically present at the facility or in warehouses, but also those in transit. In retail, it is crucial to maintain the right balance between inventory turnover and inventory levels. This is precisely why a comprehensive inventory analysis is necessary.
RBC Group offers you a comprehensive solution for conducting such an analysis. Our product is versatile and works with virtually any volume of data. Therefore, it can be used for a variety of tasks:
- analysis of inventory in the retail sector;
- analysis of inventory in the wholesale sector.
The RBC Group app allows you to view key inventory metrics and perform comparative analysis using LFL, ABC, XYZ, FMR, and other methods. You can compare data by year, quarter, and month with just a few clicks, analyze inventory in the context of previous periods, and much more.
Comparisons can be made not only with the previous period but also with the same period last year, which is convenient for conducting comparative analysis. You can also view deviation metrics in percentage or absolute terms.
Analysis of Inventory Status and the Need for Such an Analysis
The RBC Group app allows you to monitor excess inventory, reduce slow-moving stock, avoid shortages of popular items, and generally optimize inventory turnover. With its help, you can perform KPI analysis, ABC analysis, XYZ inventory analysis, LFL and FMR analysis, and transactional inventory analysis for both a single enterprise and a group of enterprises as a whole.
Let’s take a closer look at the main analysis methods available in the app:
- LFL — Like-For-Like. This method allows you to compare inventory metrics from previous periods and to compare the current period with the previous year. In the app, you can clearly see data from different periods and the differences between them—without having to perform additional manual calculations, compile them into a single table, etc. The process is automated.
- ABC-XYZ — product ranking by sales volume and sales stability analysis. This allows you to assess not only how actively a particular product is selling, but also how consistently it is being purchased. This is especially important for seasonal products.
- FMR — Fastest-Medium-Rare. This analysis allows you to evaluate the product assortment based on the frequency of requests/picks. Accordingly, there are three product groups:
- F — most frequently searched-for items;
- M — less frequently searched-for items;
- R — rarely searched-for items.
Among other things, our app allows you to analyze the geographic distribution of inventory, assess inventory levels by region, and evaluate shortages and demand. In other words, it provides accurate inventory data to help you clearly understand when restocking is necessary or when there is an excess of stock.
Who can and should manage inventory at the company
We identify three categories of individuals for whom inventory analysis and inventory management are essential components of effective business operations.
- Business owners and executives
Managing warehouse inventory will free up capital tied up in illiquid assets and increase inventory turnover rates. This approach also helps avoid stockouts and thereby prevent lost profits.
The RBC Group tool is convenient for conducting comparative and dynamic analysis; it can be used to promptly detect and prevent attempts at inventory fraud, including by drilling down to the warehouse or a specific item.
- Category managers and buyers
For this group of individuals, managing a company’s inventory offers the opportunity to optimize product assortment management, obtain timely, accurate, and objective inventory data across various dimensions, conduct supplier analysis, prevent product shortages and monitor demand, make informed purchasing decisions, manage slow-moving inventory more effectively, and gain greater control over inventory turnover.
- IT Director
For IT directors, RBC Group’s tools offer the ability to import and work with data from various sources, make changes quickly, and apply different analytical methods—whether LFL, XYZ, FMR, ABC inventory management, or other techniques. You will have at your disposal not just a convenient enterprise inventory management system, but a flexible and functional BI platform for solving a wide range of business tasks.
What challenges might a business face if it fails to manage its inventory effectively?
Without proper inventory management, there is simply no point in talking about high business efficiency. And if, for example, a retail business fails to conduct a comprehensive analysis of its inventory, it is bound to face serious problems sooner or later. Among the most common issues are the following:
- Excessive spending on moving goods between points of sale and storage. This may be due to stock shortages across the network and disruptions to the delivery schedule.
- Difficulties in identifying lost sales and pinpointing where the retail network is incurring losses. Without a specialized logistics inventory management system, determining this will be extremely difficult—and in some cases, impossible.
- Regular shortages of the best-selling products and, as a result, even more lost sales and profits. What’s worse, this gradually erodes customer loyalty, pushing them toward competitors who can guarantee product availability.
- The lack of a convenient and intuitive tool to identify the causes of excess inventory in warehouses and retail locations. As a result, suppliers sometimes have to literally “push” products into stores with discounts and incentives just to get rid of excess stock.
- The gradual accumulation of illiquid and/or expired goods in warehouses, which must either be sold off for next to nothing or written off entirely. As a result—no real profit, only losses.
- High levels of overstock, as working capital is effectively frozen, while the need for loans and working capital continues to grow. At the same time, interest rates on loans are rising.
In retail, the effectiveness of virtually any business depends directly on the proper management of inventory and orders. For a business to operate effectively, the right product must be in the right place at the right time and in the right quantity. At the same time, inventory levels in the system must not be excessive.
Managing inventory in the warehouse and throughout the logistics chain allows you to answer three key questions:
- What should I order?
- How much should I order?
- When and where should I stock up?
With accurate and objective answers to these questions, you’ll be able to run your business more efficiently and achieve better results while significantly reducing costs.
Results Achieved Through Inventory Management
Not all entrepreneurs and business owners fully appreciate the significant impact that inventory analysis and control have on a company’s operations and growth. In fact, implementing RBC Group’s inventory management tools can dramatically improve a company’s performance:
- Expand the product range. A business can significantly expand its product range by optimizing shelf space in warehouses and retail locations.
- Reduce the rate of lost sales by up to 60%. As a result, revenue per square meter of retail space effectively increases.
- Reduce excess inventory by 30–60%. As a result, the number of write-offs and spoiled products that could not be sold is reduced.
- Minimization or complete elimination of order-processing errors caused by the “human” factor.
- Optimization of the company’s personnel costs through the automation of most order-processing procedures.
In this way, with a relatively small investment in implementing an inventory analysis system, you can significantly optimize your production and warehousing processes, improve sales performance, and reduce associated costs, which is particularly important for businesses operating in a highly competitive environment.
What factors should be taken into account when managing inventory in logistics and warehousing?
It is important to understand that inventory accumulates in one way or another at every stage of the supply chain—in company warehouses, in transit, in the storage facilities of retail businesses, and so on. And the more participants there are in the supply chain, the more inventory can accumulate.
How important is it to build up inventory, anyway?
The need to build up such reserves stems from several factors:
- The time required to transport goods from the production facility to the retail location(s). This includes the time spent loading and unloading goods, which can be a very significant factor when dealing with specific types of goods.
- Seasonal fluctuations in product demand and production. Many product categories are in demand only during a specific season. This must be taken into account when managing inventory.
- Potential mismatch between the production and retail product ranges. As a result, sorting, repackaging, and reworking may be required.
- The specific geographical location of production facilities. This is where the first factor mentioned—transportation time—comes into play. The farther away the production facility is, the larger the inventory typically needs to be at retail locations to avoid shortages in the event of delivery delays.
- Product transportation conditions, the distance between the manufacturer/supplier and the direct seller. This point directly follows from the previous one.
- The number of links in the supply chain. The more links in this chain, the greater the risk that a force majeure event, a delay in product delivery, or similar issues will occur at a specific link. This also affects the need for inventory in logistics and warehouses.
- Storage capabilities and storage duration. The more specific the storage conditions and the shorter the storage period, the more critical it becomes to analyze inventory levels and prevent excess stock.
The effectiveness of inventory management depends directly on the analytical tools you use and how comprehensively you apply them. RBC Group’s pre-configured “Inventory Analysis” solution allows you to automate and optimize these processes, reduce costs, and increase business profitability—in some cases, significantly!
If you’d like more detailed information about our offering, please submit a request on our website. Or request demo access to the RBC Group tool to personally evaluate its benefits and capabilities in practice.

