


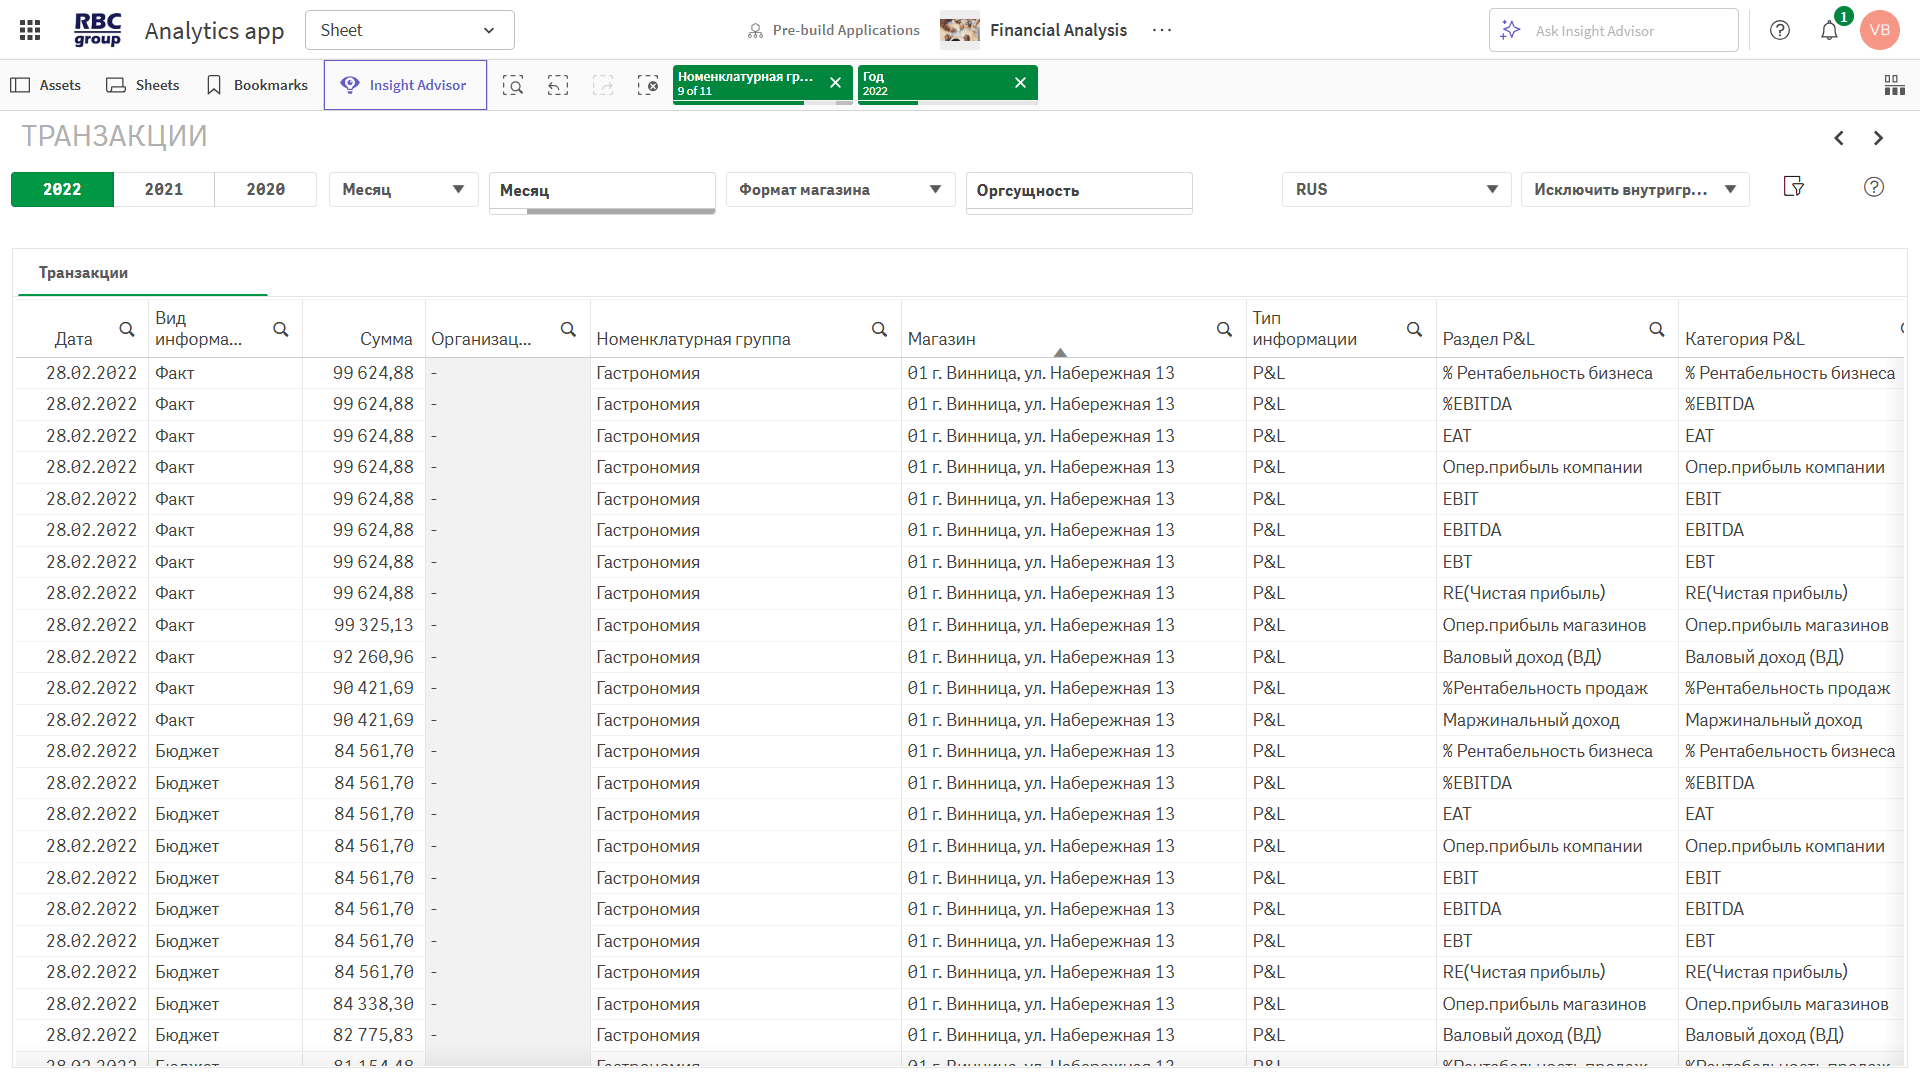
Financial Analysis: Azerbaijan
The application allows you to automate the calculation of key performance indicators, generate financial statements, and gain a clear overview of the financial and operational activities of a company or group of companies in Azerbaijan


How is financial consolidation performed for a group of companies, taking into account internal transactions?

Which legal entities or business segments contribute the most to the group’s overall results?

Is it possible to automatically allocate revenues and expenses among departments and legal entities?

Is it possible to manually adjust the allocation rules and analyze different scenarios?

How do revenue, expenses, assets, and liabilities vary by Central Federal District and by period?

Where are cash flow gaps and budget overruns occurring?

Which items contribute most to net income, liquidity, and debt burden?

Where are financial stability risks reflected in the ratios?

Which cost items are reducing profitability, and which ones can be optimized?

What is the forecast for profit and cash flow at the end of the month/quarter?

What is the capital structure and debt burden by organization?

What are the differences between the plan, actual results, and last year’s figures for key metrics?
a BI platform


This preconfigured solution enables you to perform financial ratio analysis—including budget-versus-actual, trend, percentage, comparative, and LFL analysis—of financial data for a company or group of companies; and to automate the analysis process: P&L, Balance, CashFlow, key indicators of working capital, profitability, financial stability, and liquidity
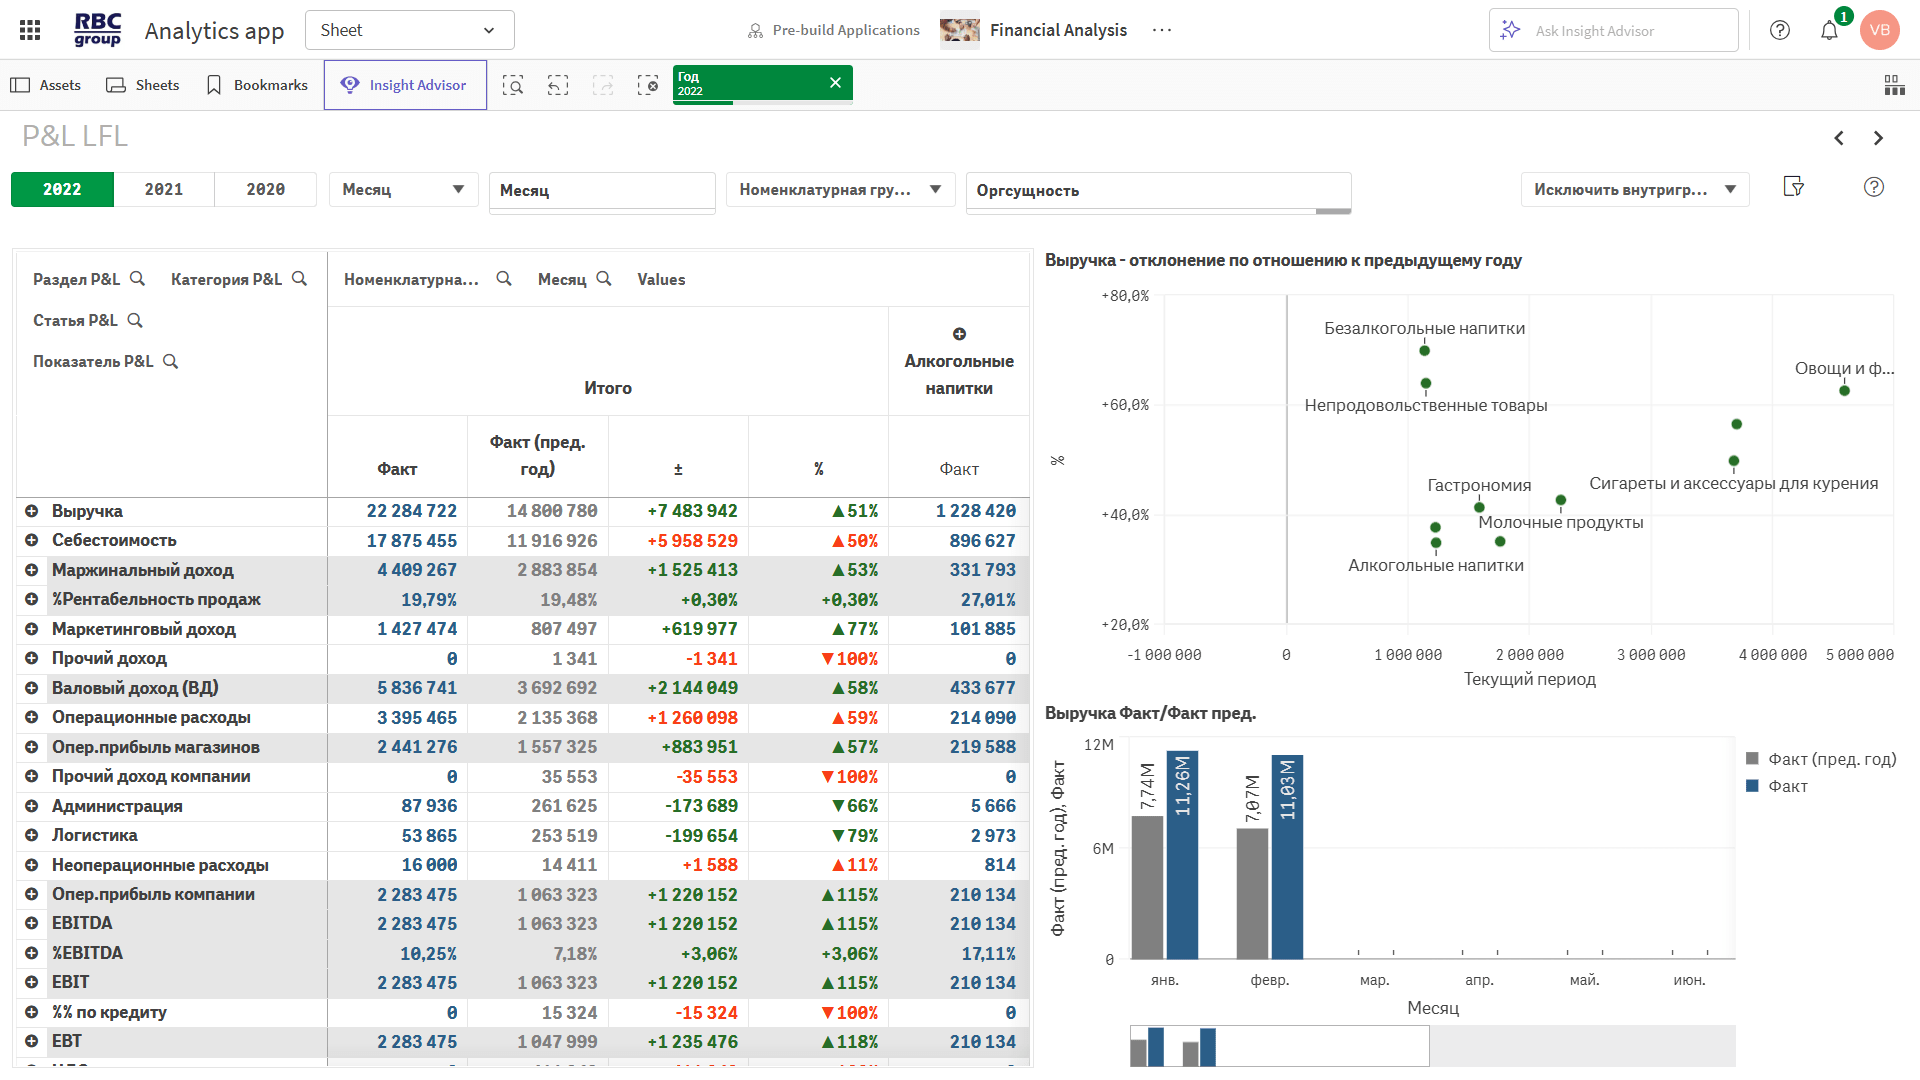
This preconfigured solution enables the analysis of financial ratios, as well as plan-versus-actual, trend, percentage, comparative, and LFL analysis of financial data for a company or group of companies.
The tool automates the analysis process: P&L, Balance, CashFlow, as well as the company’s working capital, profitability, financial stability, and liquidity ratios.
Allows you to track key indicators of profitability, liquidity, and balance sheet structure.
◾ P&L: revenue, variable and fixed costs, EBITDA, net income
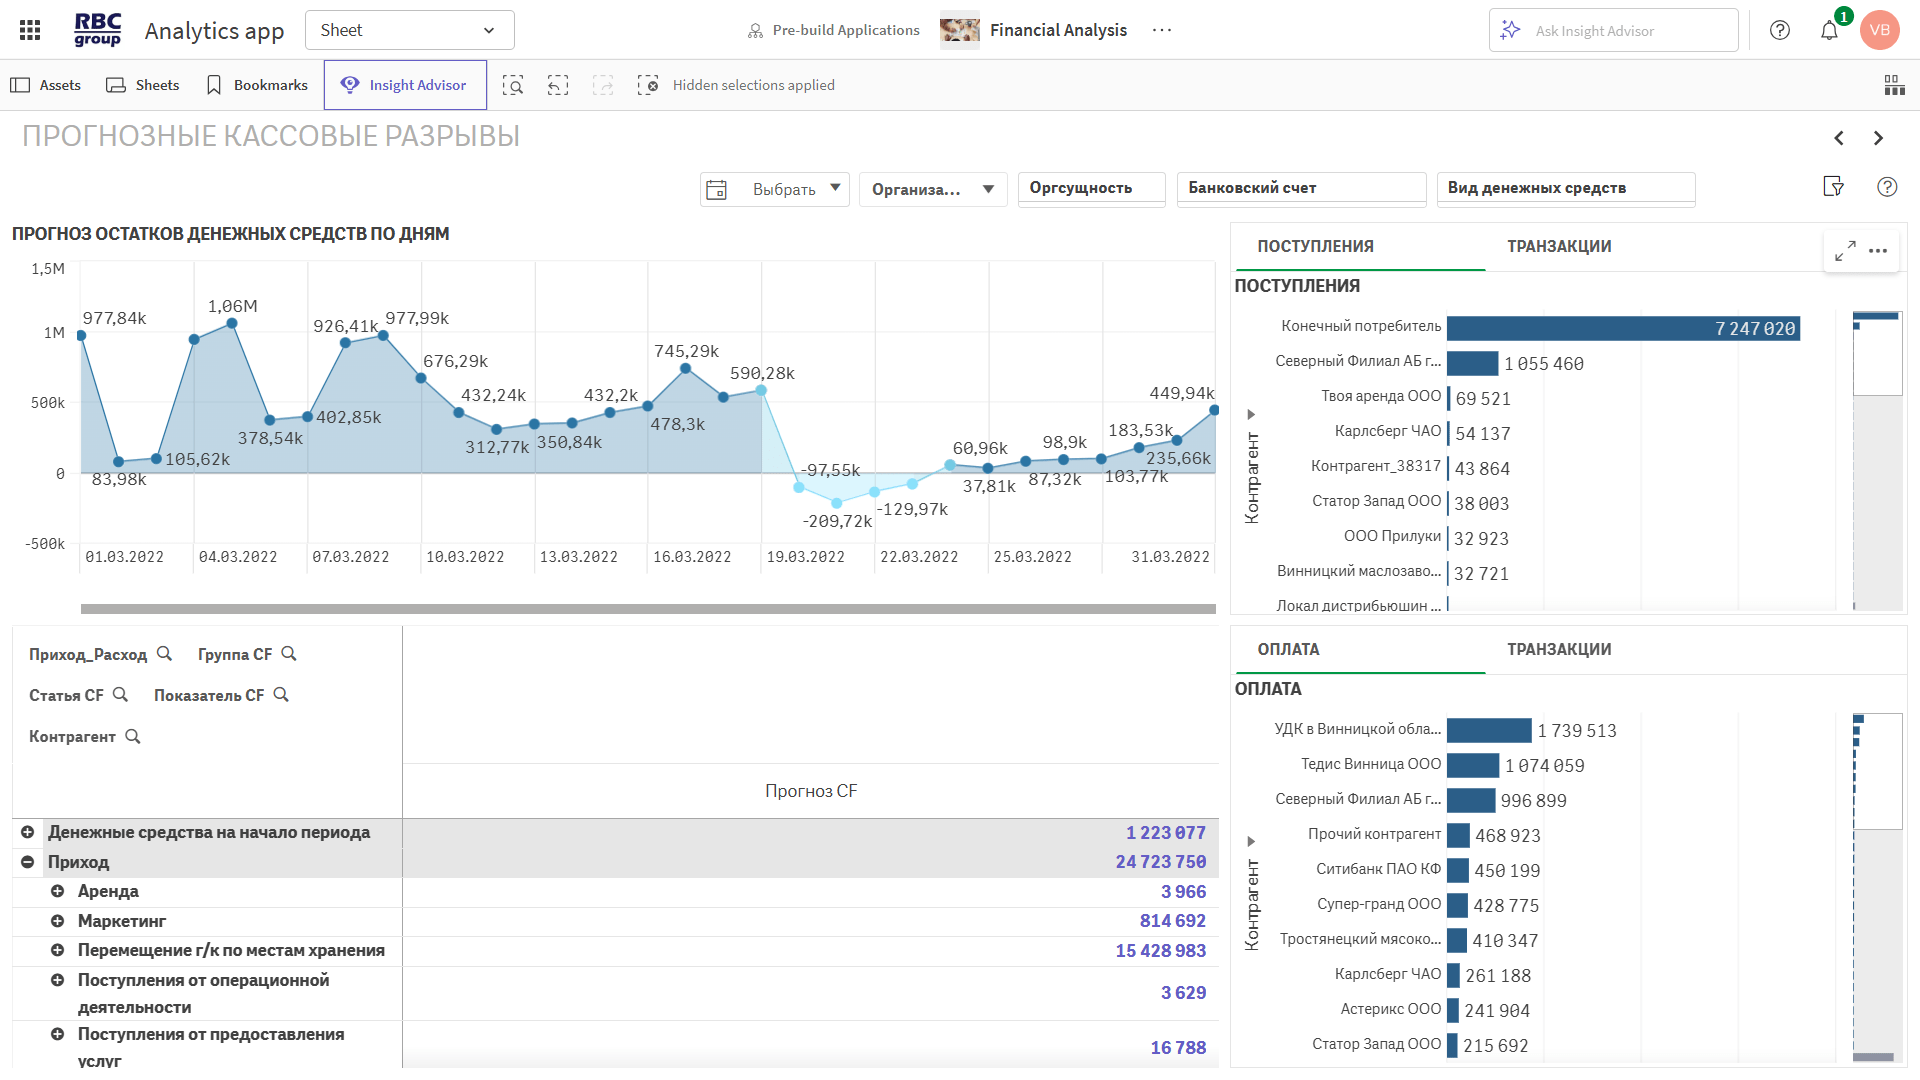
◾ Cash Flow: inflows, outflows, balances, cash gaps
◾ Balance Sheet: assets, liabilities, equity
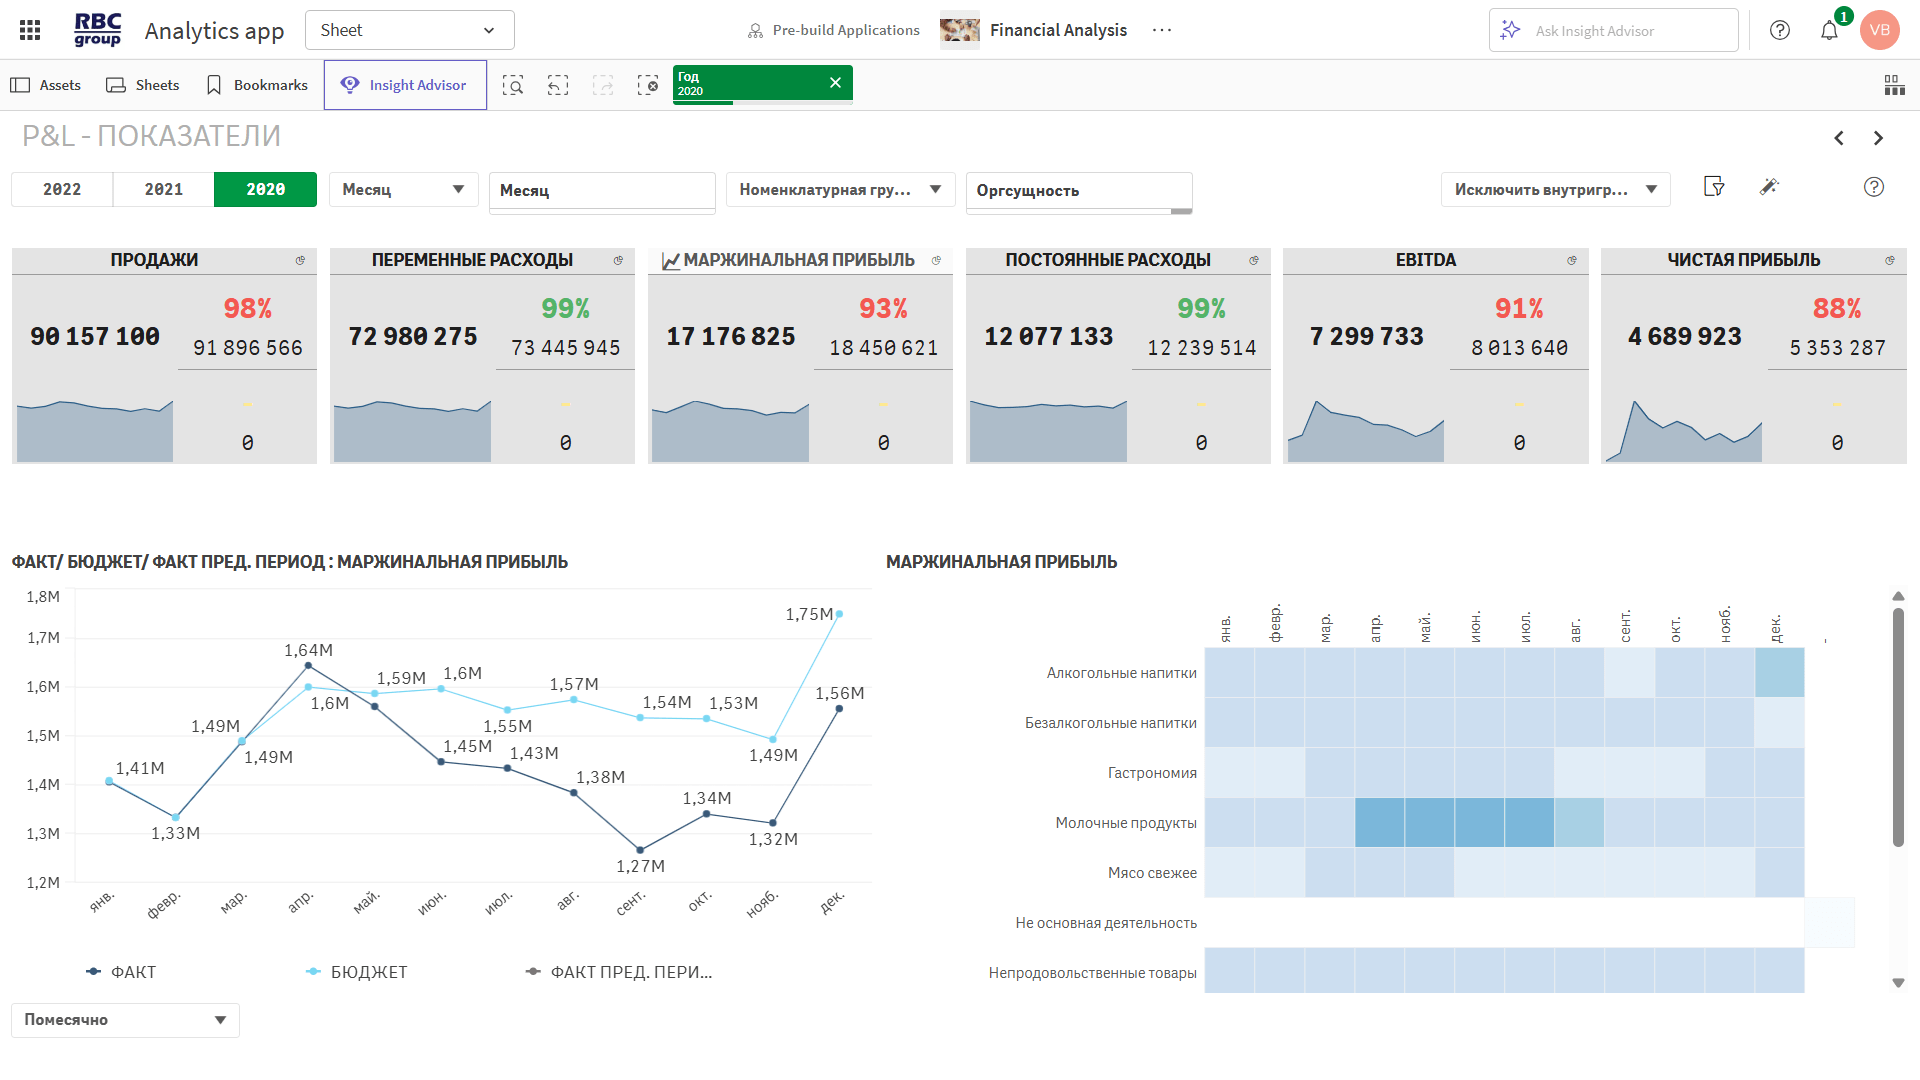
Shows variances from the budget and allows you to analyze the structure and trends across all line items.
◾ Plan-vs.-actual analysis for each segment
◾ Comparison with the budget and the previous year
◾ LFL and vertical analysis
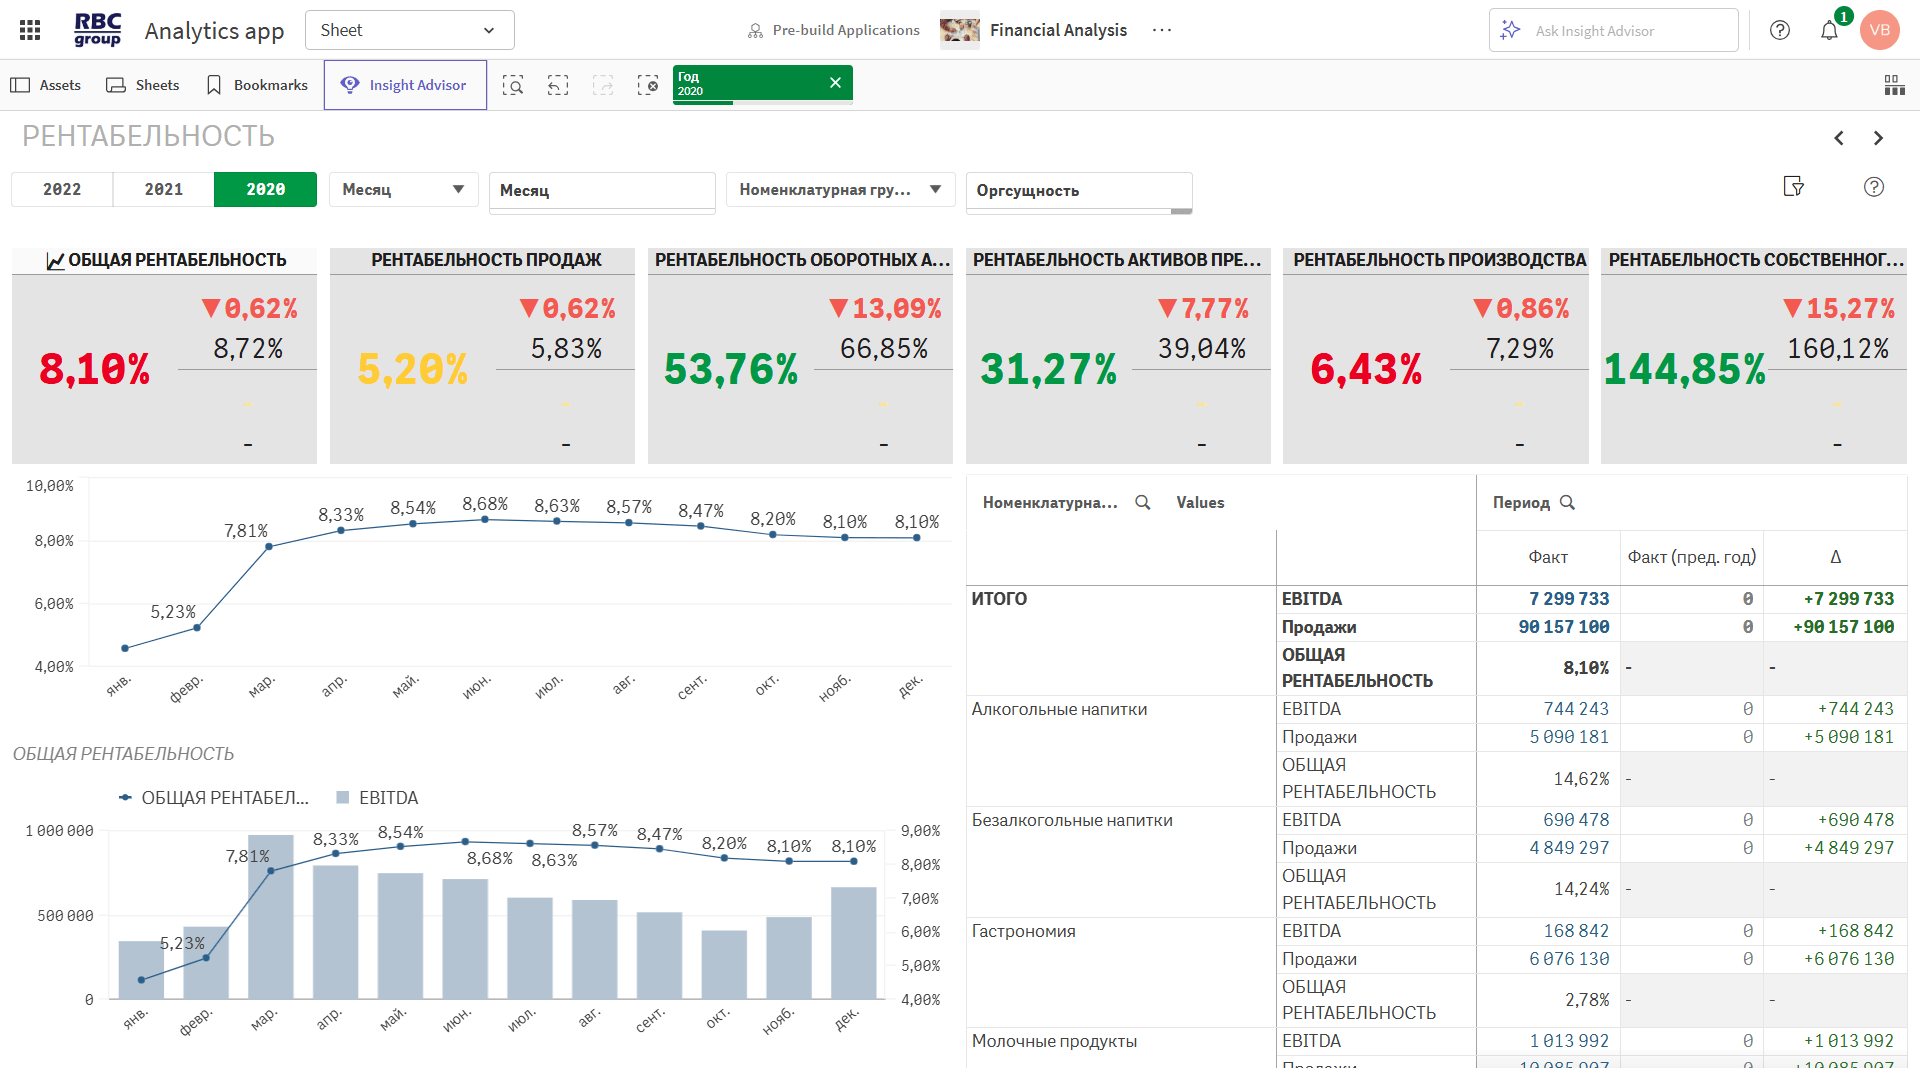
They assess the stability, efficiency, and financial health of a business.
◾ Profitability by type of income
◾ Liquidity and financial independence
◾ Asset turnover and debt burden
Tools for scenario analysis and change readiness.
◾ Profit and cash flow forecasting
◾ Cash gap modeling
◾ What-if analysis of costs, revenue, and loans
Support for multidimensional analysis and management at all levels.
◾ Breakdown by Central Federal District, legal entities, and business lines
◾ Drill-down to transactions and financial statement line items
◾ Visualization and report builder

In just 30 minutes, you’ll learn how a BI solution integrates P&L, cash flow, and the balance sheet into a single model, helping you identify variances, forecast metrics, and manage profitability.
We’ll demonstrate a ready-to-use analytical solution with minimal implementation requirements.
The system automatically allocates revenue and expenses to departments, projects, legal entities, and segments.
Result: transparency in profitability and control over the cost structure.
P&L, Cash Flow, and Balance Sheet are integrated into a single model with end-to-end analysis capabilities.
Result: a comprehensive view of financials and the relationships between key metrics.
Access to the budget, trends, and variances for all items—all on a single screen.
Result: timely response to changes and deviations from the budget.
Automatic calculation of key ratios and early detection of cash flow gaps.
Result: stability, risk reduction, and strengthened financial discipline.
Simulation tools help assess the consequences of decisions in advance.
The result: informed planning and sustainable business development.
Flexible visualization and drill-down to the transaction level for any metric.
Result: manageability at all levels and confidence in the data.


RBC Group enhances its clients' competitiveness by implementing modern business analytics, data integration and management, artificial intelligence, and advanced analytics systems.


 26
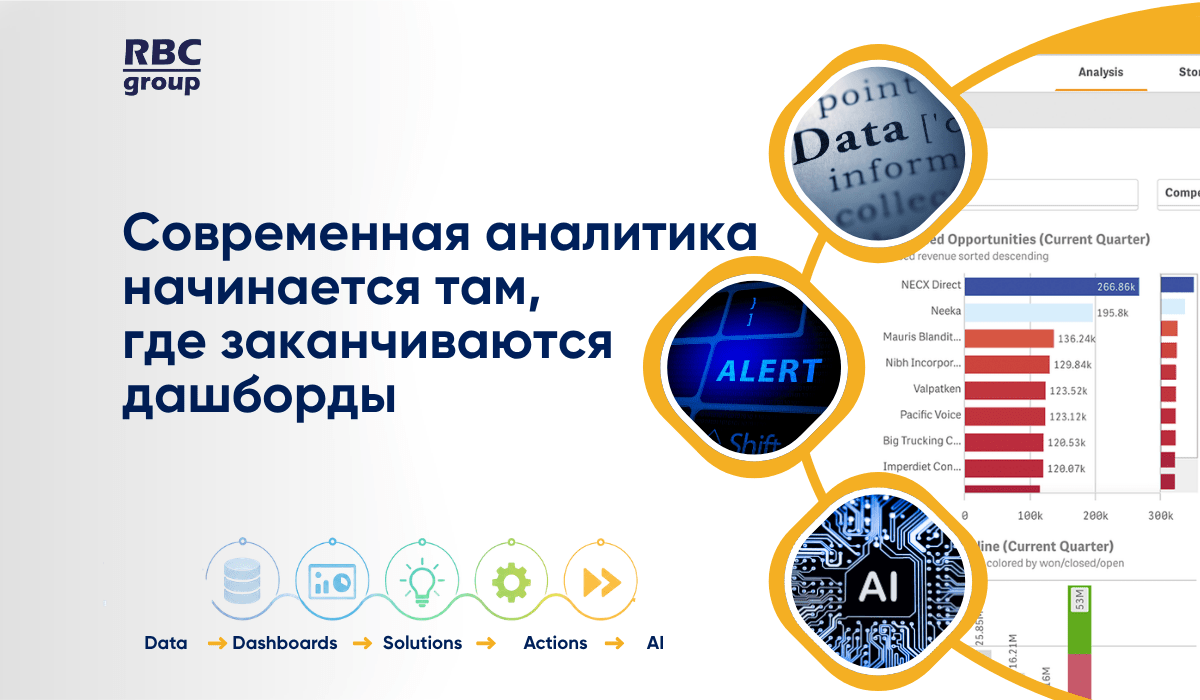
26Современная аналитика — это уже не просто дашборды. Рассказываем, почему бизнесу недостаточно видеть данные и как современные BI-платформы помогают быстрее принимать решения, автоматизировать действия и использовать возможности ИИ.
 35
35Qlik сегодня — это уже не просто BI. На Qlik Community Uzbekistan 2026 участники обсудили будущее аналитики, облачные технологии, интеграцию данных и возможности Agentic AI. Делимся ключевыми выводами и инсайтами мероприятия.
 16
16Почему высокая активность торговых представителей не всегда означает эффективную работу на территории? Рассмотрим ключевые показатели, практические сценарии и подход к управлению торговыми визитами на основе данных.
26Современная аналитика — это уже не просто дашборды. Рассказываем, почему бизнесу недостаточно видеть данные и как современные BI-платформы помогают быстрее принимать решения, автоматизировать действия и использовать возможности ИИ.
35Qlik сегодня — это уже не просто BI. На Qlik Community Uzbekistan 2026 участники обсудили будущее аналитики, облачные технологии, интеграцию данных и возможности Agentic AI. Делимся ключевыми выводами и инсайтами мероприятия.
16Почему высокая активность торговых представителей не всегда означает эффективную работу на территории? Рассмотрим ключевые показатели, практические сценарии и подход к управлению торговыми визитами на основе данных.
Warning: foreach() argument must be of type array|object, false given in /home/rbcgrp/rbcgrp.com/www/wp-content/themes/theme-sp/template/blog.php on line 374

Financial Analysis: Getting a Company’s Financial and Operational Activities in Order
Financial analysis of a business is one of the key components of successful commercial operations and financial stability. It allows for an objective assessment of the company’s actual position, the identification of existing risks, the discovery of positive growth factors, and the forecasting of the company’s future development.
An analysis of a company’s financial condition consists of three main components:
- Analysis of the company’s financial position and capital structure.
- Assessment of capital efficiency and capital intensity.
- Analysis of the company’s financial stability.
RBC Group offers comprehensive tools for automating the calculation of key financial indicators, generating financial statement components, and providing a clear overview of a company’s financial and operational activities—or even a group of companies. You can request demo access directly on our website to experience firsthand all the benefits and capabilities of our solution.
Data sources and how to work with them
Financial analysis of a company draws on several data sources. The main ones are:
- A balance sheet contains information about the company’s assets and liabilities by reporting period.
- A statement of income and financial results, showing revenues, expenses, net income, and net losses.
- A statement of changes in equity, providing data on the company’s equity and changes in its value.
- Cash flow statements reflecting receipts and payments, as well as their equivalents, for the reporting periods.
- Other financial documents are analyzed as appropriate.
Our app allows you to use all of these and other data sources to perform financial ratio analysis and other analyses, such as budget-to-actual, trend, and comparative analyses. More details are provided below.
Financial Analysis: Key Methods
Vertical analysis
This method of analysis is based on setting current figures to 100% and then calculating the percentage of the total for selected items. This makes it possible to determine the relative weight of the various components.
As part of a vertical analysis, also known as a structural analysis, the following indicators are analyzed:
- assets—for subsequent optimization;
- capital—to determine its weighted average cost;
- cash flow—by business segment and for various purposes.
This method is quite common, but it is by no means the only one.
Horizontal analysis
It is also known as the “time-series” method. This implies that we compare data across different periods. In this way, we can clearly see the growth rates of the industries we are interested in, track trends, and observe how they are influenced by objective factors.
This method is often used by companies whose operations and profitability are heavily tied to seasonality. The most objective results can be obtained by combining the vertical and horizontal methods.
Comparative Analysis
A convenient method for comparing different sets of metrics—not only within the company, but also against competitors’ data.
This allows you to:
- compare with competitors to identify the most advantageous position;
- conduct objective industry-wide analysis;
- compare comparable data across different departments within the company;
- analyze current metrics and compare them with targets to track whether the company is falling behind or, conversely, exceeding its targets.
The comparative method can be used either independently of other methods or in combination with them.
Trend Analysis
In fact, this is a variation of the horizontal method, but it is typically classified as a separate category. The key feature of this method is the use of indicators from a specific period as a baseline. This baseline is then used as a reference point when comparing indicators with those from other periods.
Factor Analysis
In this case, multivariate analysis is used, which makes it possible to examine the impact of individual factors on the outcome. Factors taken into account include socioeconomic changes and transformations, price fluctuations, changes in legislation, and much more.
At the same time, almost any factor can be broken down into its individual components, thereby providing an even more objective assessment of its impact on the company’s financial performance.
Analysis of ratios
This is an important method for accurately calculating a company’s liquidity and solvency ratios. It also helps determine whether the company has sufficient funds to meet its financial obligations, as well as how quickly and easily its assets can be converted into cash if necessary.
Analysis of an Organization’s Financial Stability
A company’s financial stability is one of its key characteristics, especially in times of market uncertainty and instability.
By using a set of diverse ratios, it is possible to accurately assess the company’s financial condition and analyze its absolute indicators of financial stability.
A company’s financial stability is influenced by a wide range of factors that must be taken into account:
- the company’s current position in the commodity and financial markets;
- the production and sale of competitive and in-demand products;
- the level of dependence on creditors and investors;
- the size and structure of production costs, as well as their ratio to revenue;
- the amount of reserve capital;
- the efficiency of cash and commercial operations;
- the company’s asset potential, and much more.
There are various methods for analyzing a company’s financial stability—ranging from fairly basic to automated, intuitive, and easy-to-understand. We offer the latter option.
RBC Group offers cutting-edge software solutions for financial statement analysis designed for business owners and executives, CFOs and finance departments, and IT directors. Our products enable you to comprehensively analyze your company’s financial metrics, clearly track the balance sheet structure and its changes, visualize working capital, assess liquidity, examine financial flows, P&L, and cash flow indicators, and more. All of this is available through the convenient, intuitive, and user-friendly Qlik Sense interface.
Get a free consultation from an RBC Group specialist or request demo access today. Discover all the benefits our solution has to offer for your business!

