


Analysis of Procurement in Azerbaijan
The app allows you to analyze procurement plans and deliveries down to the SKU level, view returns and orders, and monitor the timeliness and completeness of procurement fulfillment in Azerbaijan


Where do the main cost overruns in procurement occur?

What is the breakdown of purchases by supplier, category, and region?

Which supplier consistently misses delivery deadlines?

How do returns affect financial results, and where is their impact most critical?

Which products account for the largest portion of the procurement budget?

How have purchase prices for key items changed over the past year?

How accurate is the demand forecast, and where do shortages occur?

Which suppliers ensure high quality and on-time delivery?

Where is there a reliance on a single supplier?

What does the LFL comparison of purchases by category and period show?

Which items are purchased regularly but don't sell?

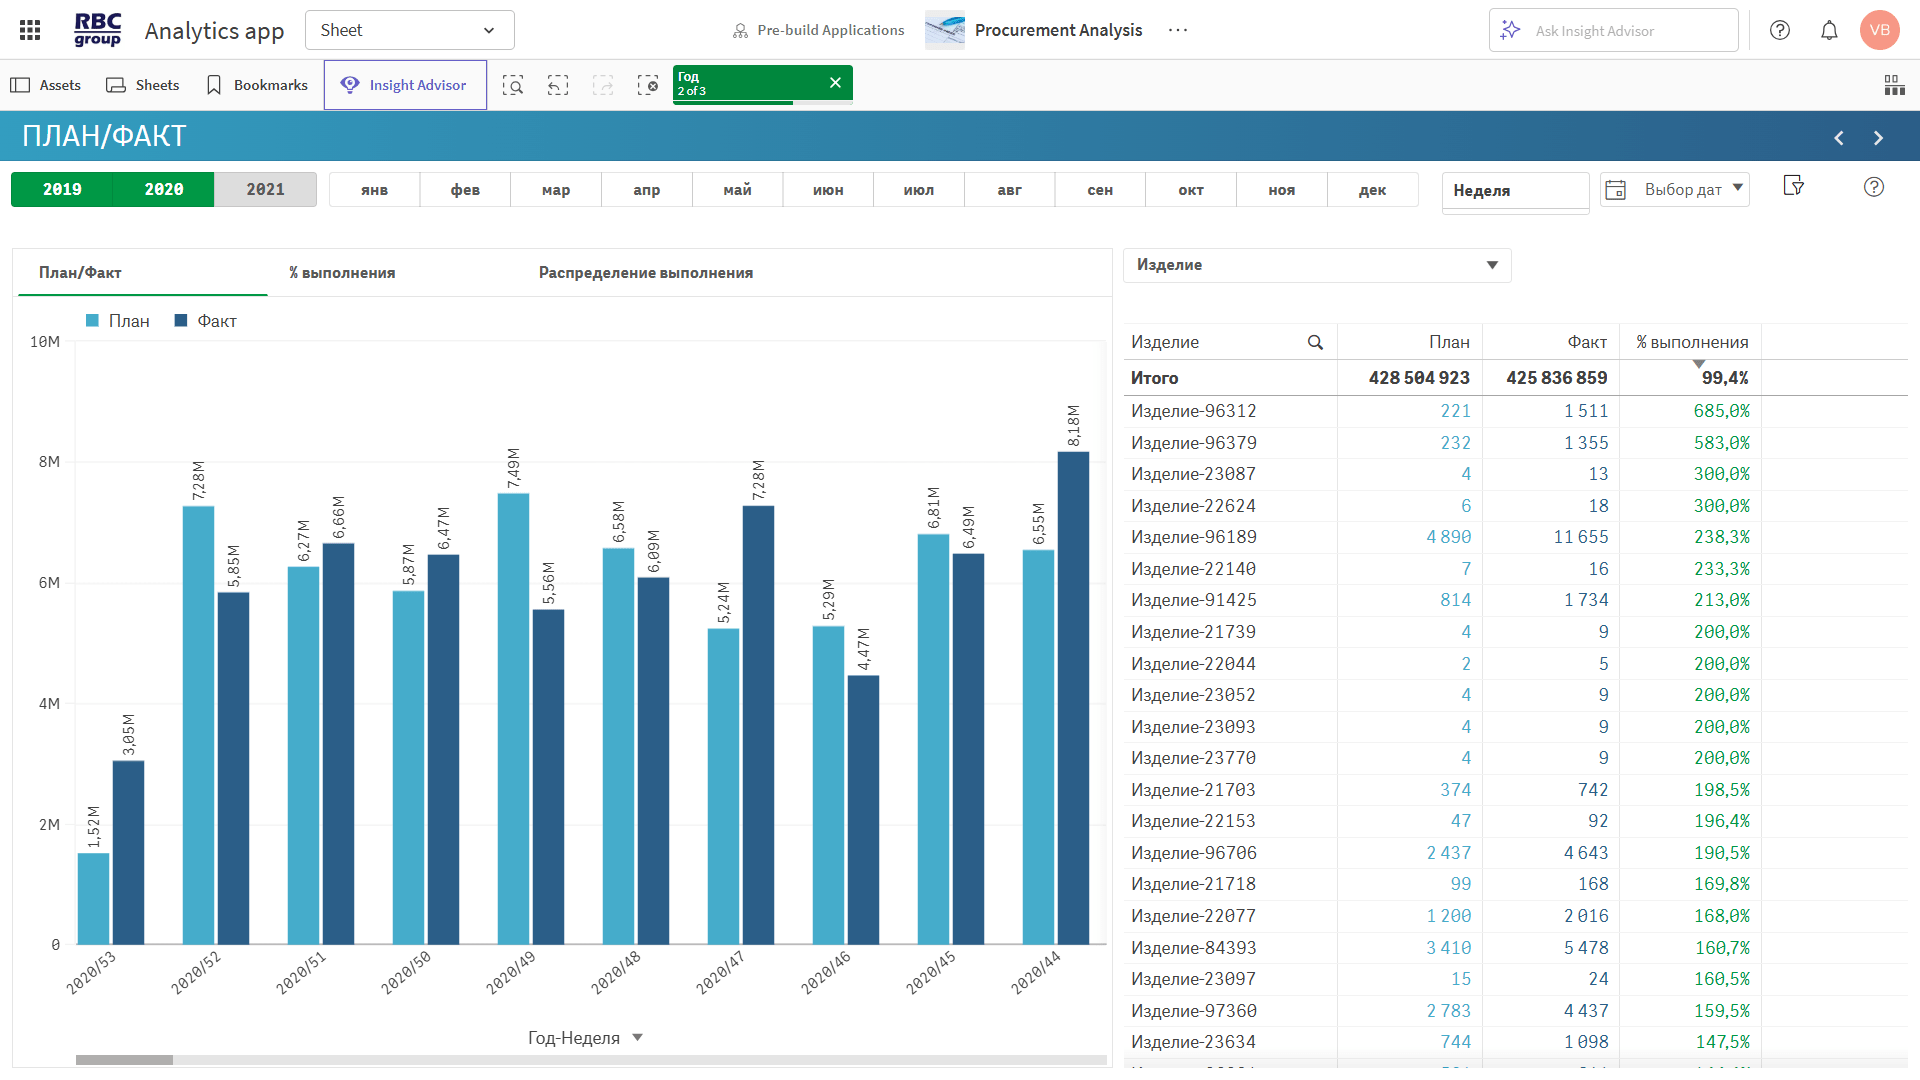
How do purchases deviate from the plan in terms of cost and quantity, and what does this mean?

The preconfigured "Procurement Analysis" solution enables a 360° analysis of procurement across all relevant dimensions: products, suppliers, buyers, procurement plans, and order-level details. The application analyzes the price and quantity of purchased SKUs, delivery times, planned vs. actual delivery schedules, returns, and defective items. All metrics can be analyzed over time, and you can track the relationships between them.
They assess the total volume of purchases and deviations from the budget.
◾ Purchase Volume — actual costs for goods and services.
◾ Purchase Plan / Variance — comparison with the budget by category and period.
◾ Savings / Overrun — the difference between the plan and actual figures, with a breakdown of the reasons.
◾ Net Shortfall — the total value of all undelivered goods.
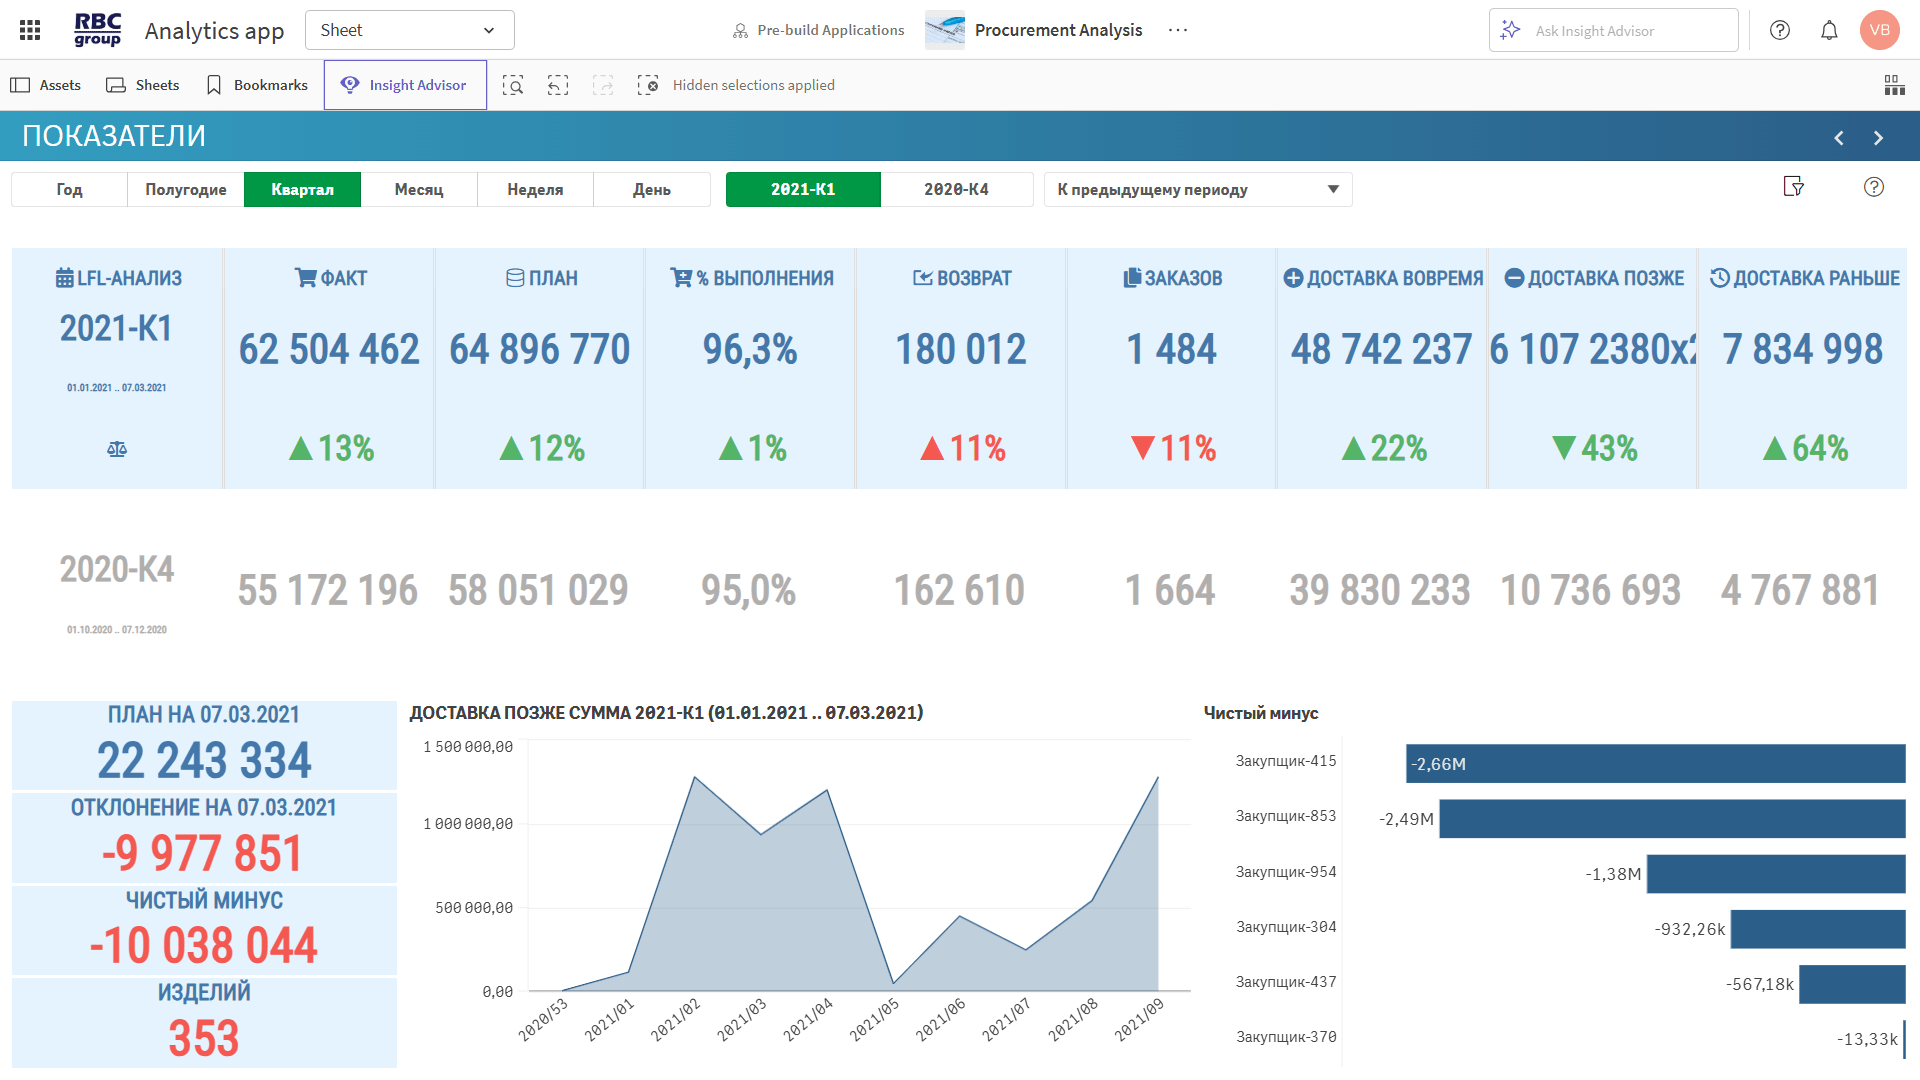
Track the status of requests and ensure deadlines are met.
◾ Number of orders — overall activity of the procurement department.
◾ On-time / late / early delivery — adherence to delivery deadlines.
◾ % of plan fulfilled by date — timeliness of order fulfillment.
◾ Inventory turnover — the rate at which purchased goods are used or sold.
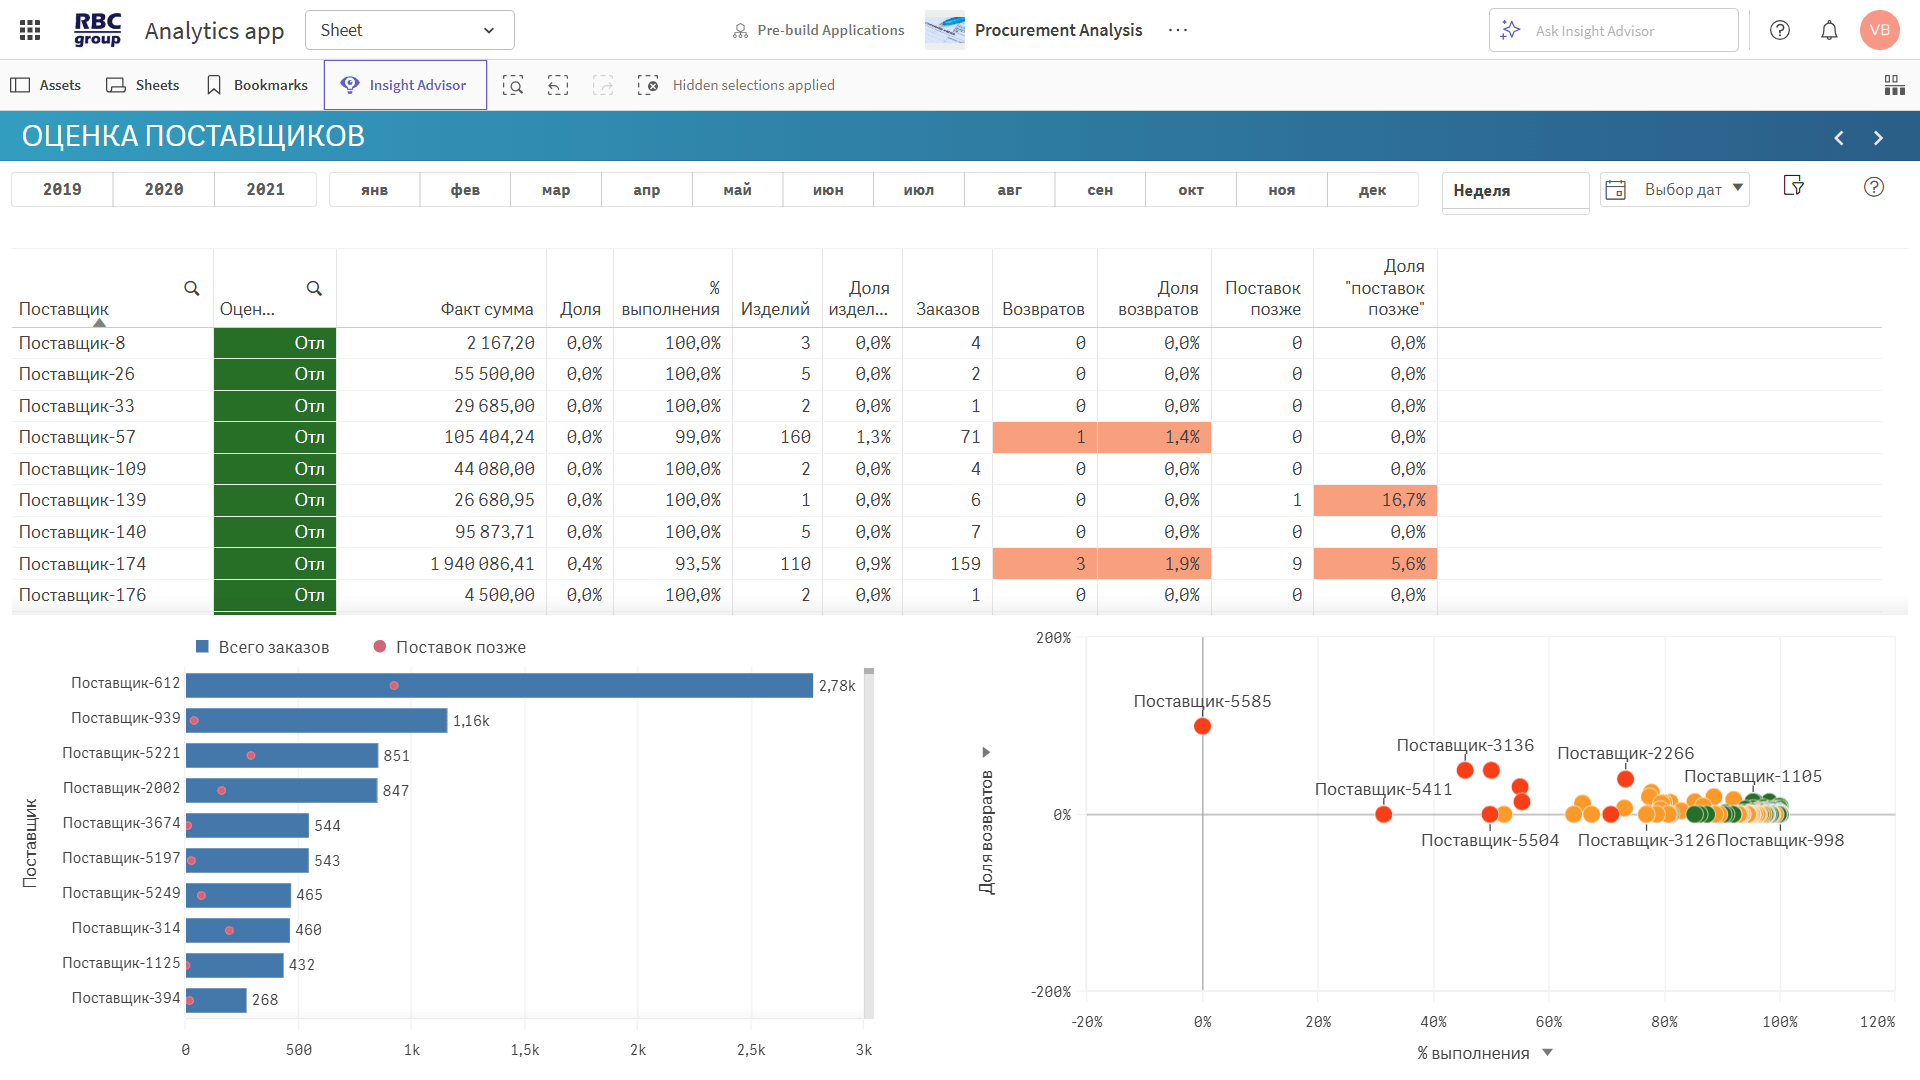
These factors characterize the quality of suppliers' work and the degree of dependence.
◾ Supplier rating — an index based on delivery times, returns, and reliability.
◾ Top suppliers by value and volume — key partners and dependency risks.
◾ % of returns / % of late deliveries — indicators of supply stability and quality.
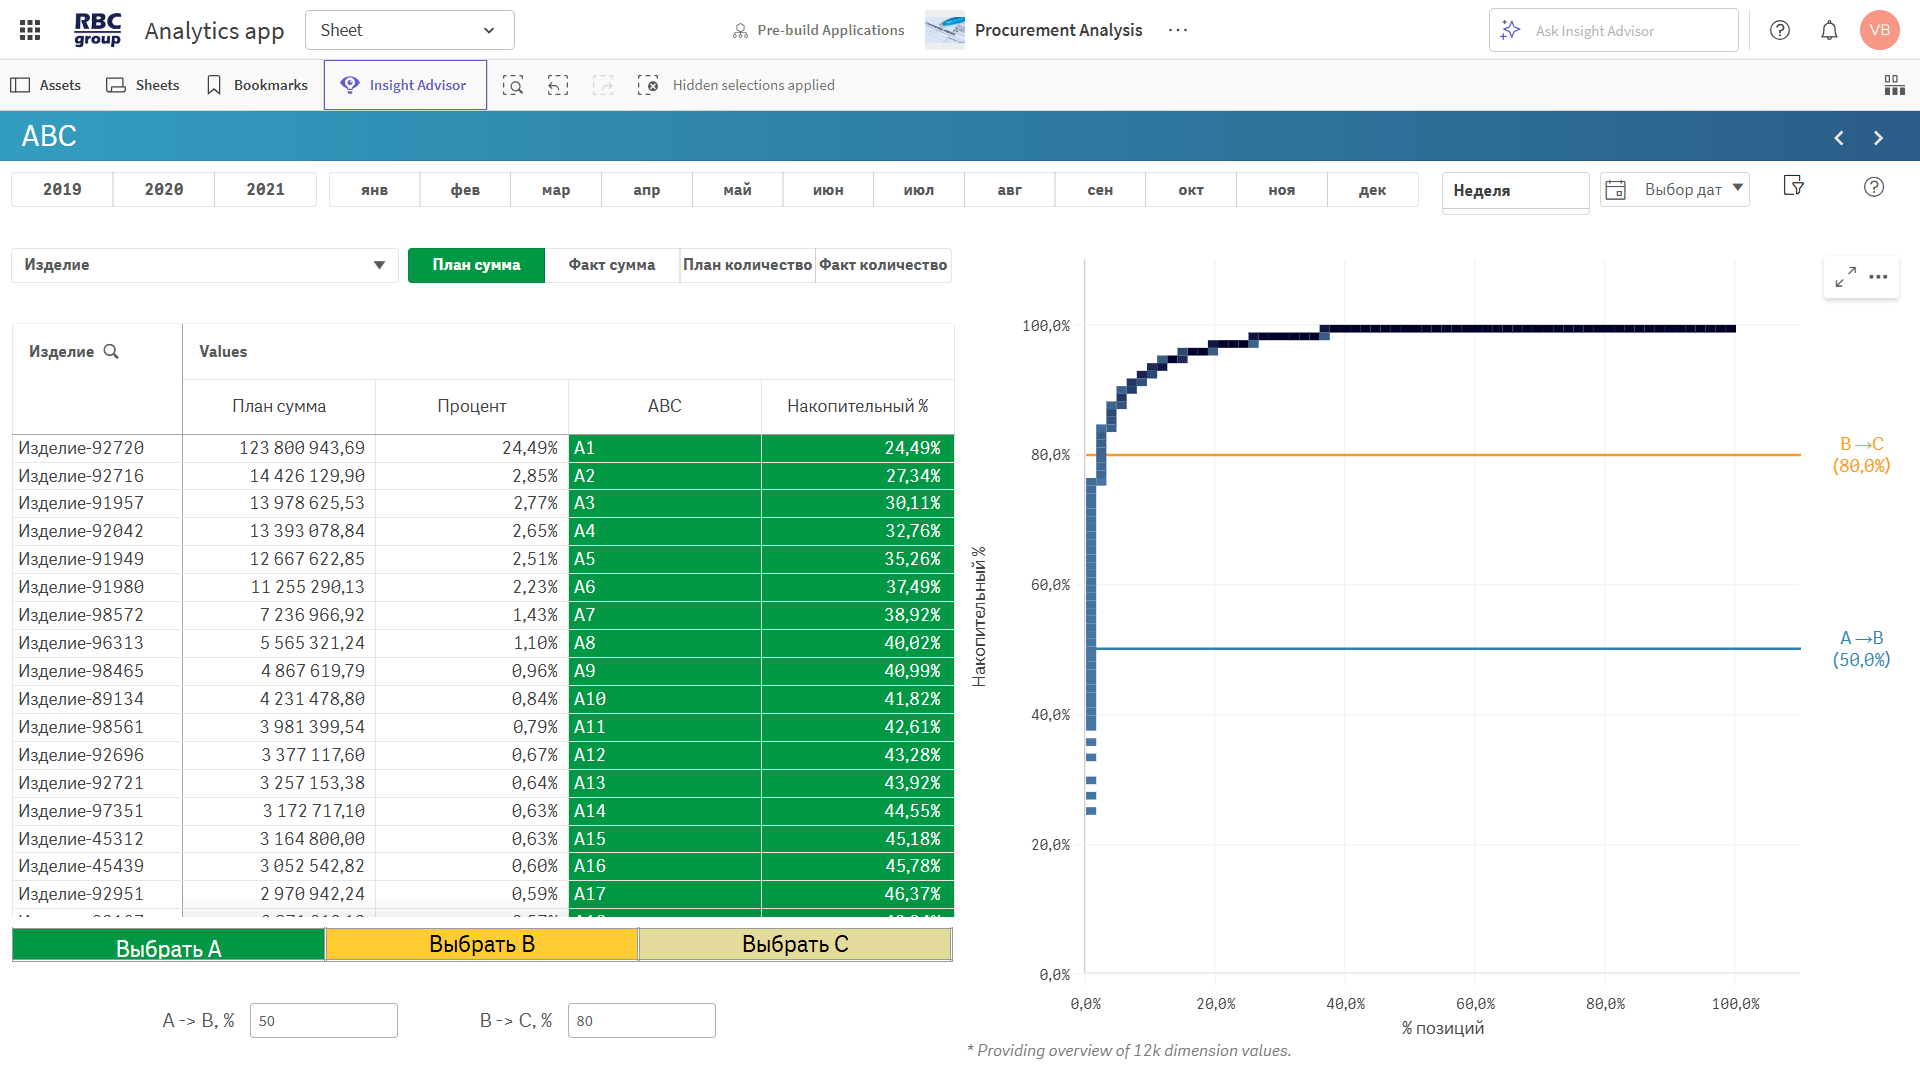
They help you identify which purchases have the greatest impact on the budget.
◾ Top purchased items — the biggest drain on the budget.
◾ Purchase prices — trends and history by product and supplier.
◾ ABC analysis — focus on critical and high-cost items.
They make it possible to monitor and explain discrepancies.
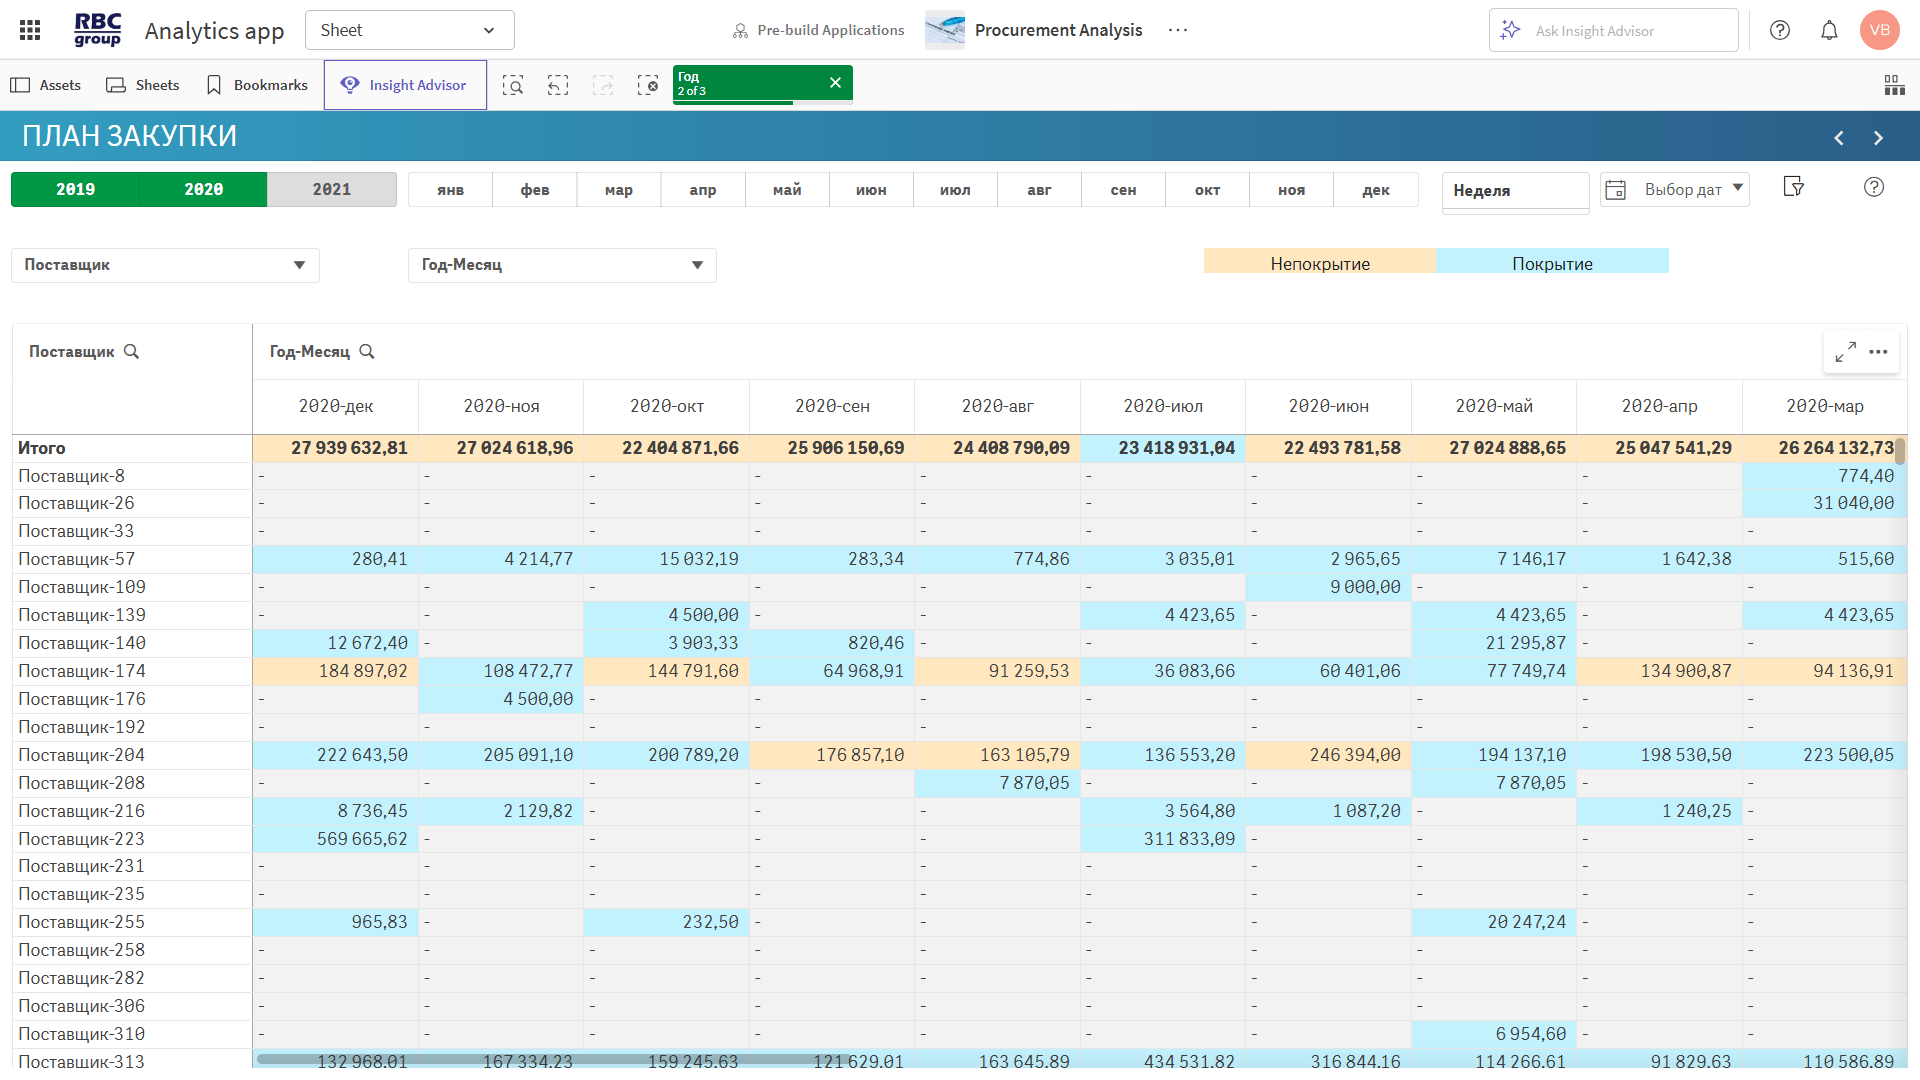
◾ Plan / Actual / % Completion — metrics showing the status of purchases in terms of total amount and volume.
◾ Deviation for Today — the current shortfall or overspend.
◾ Purchase Volume Planned for Today — the amount that should have been purchased by today.
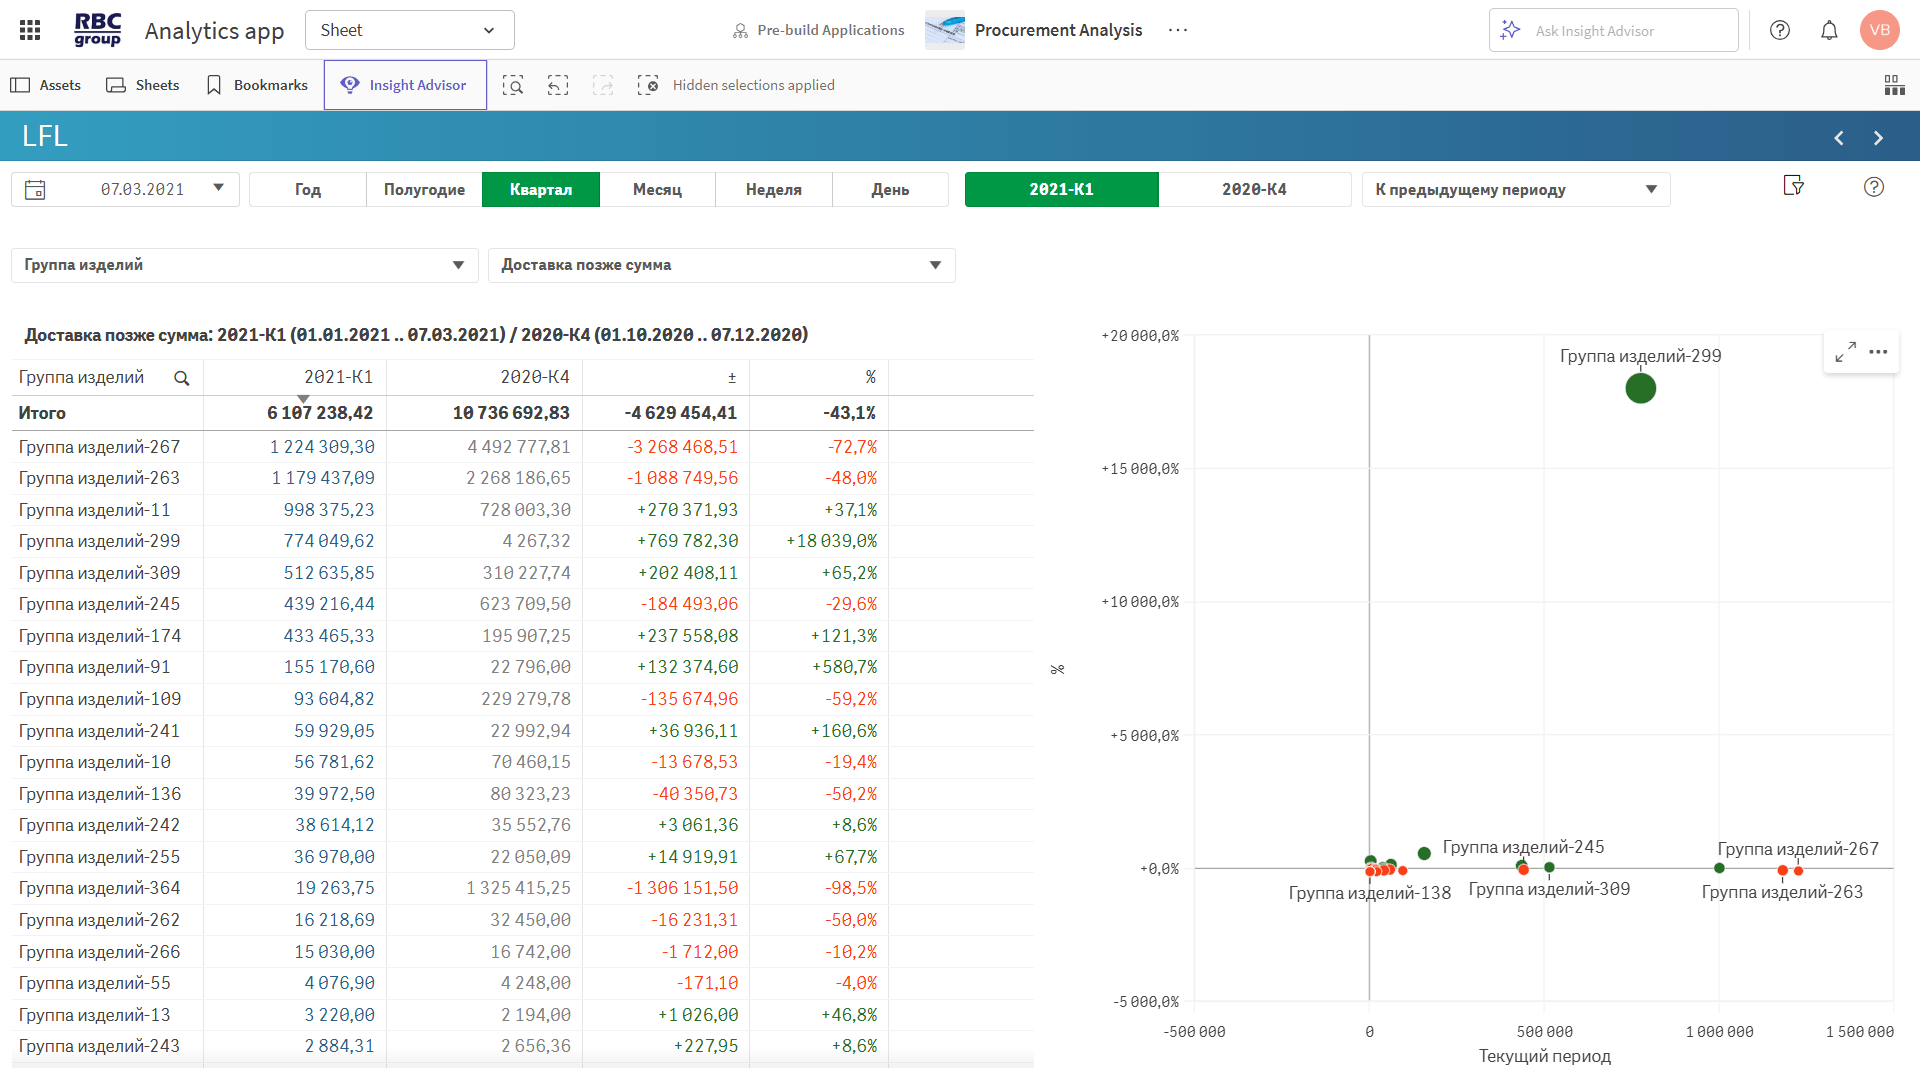
They help assess the causes of deviations and the impact of changes.
◾ PVM analysis — the impact of price, volume, and mix on cost growth.
◾ Factor analysis — sources of variance: price increases, volume increases, or logistics.
◾ What-if analysis — modeling changes in procurement conditions.
◾ LFL analysis — comparison of purchases across similar periods and categories.
We aggregate data from ERP systems, Excel, and other sources into a single BI platform—accessible from anywhere, at any time.
We show you on a single screen where overspending is occurring, where delays are happening, and where you can cut costs and optimize processes.
Built-in supplier reliability index—based on delivery times, returns, and volume. Quickly compare, filter, identify risks, and pinpoint areas for growth.
Analyze why the budget is increasing: is it due to prices, structure, or volume? Focus on priority items and high-cost items.
Conduct what-if simulations and LFL analysis to understand how purchasing will change under new conditions and what factors influence trends.
From the general to the specific—in just 2–3 clicks: browse purchases by category, product, supplier, or document. Everything is interconnected and easy to understand.


RBC Group enhances its clients' competitiveness by implementing modern business analytics, data integration and management, artificial intelligence, and advanced analytics systems.


 26
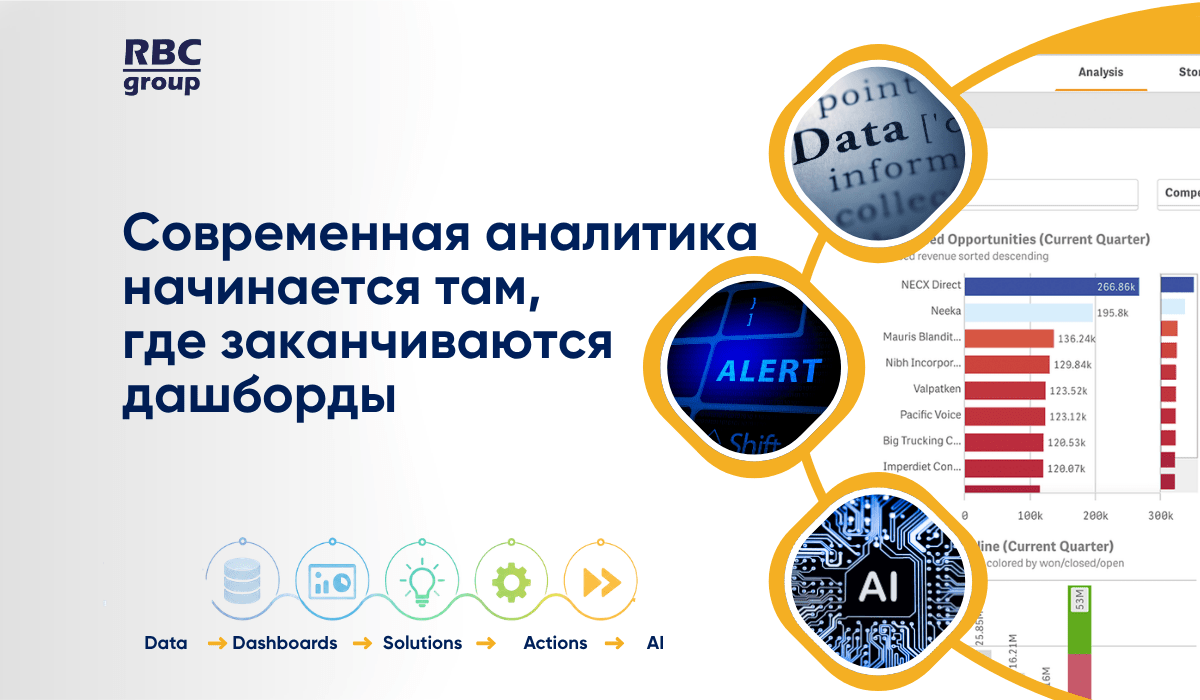
26Современная аналитика — это уже не просто дашборды. Рассказываем, почему бизнесу недостаточно видеть данные и как современные BI-платформы помогают быстрее принимать решения, автоматизировать действия и использовать возможности ИИ.
 35
35Qlik сегодня — это уже не просто BI. На Qlik Community Uzbekistan 2026 участники обсудили будущее аналитики, облачные технологии, интеграцию данных и возможности Agentic AI. Делимся ключевыми выводами и инсайтами мероприятия.
 16
16Почему высокая активность торговых представителей не всегда означает эффективную работу на территории? Рассмотрим ключевые показатели, практические сценарии и подход к управлению торговыми визитами на основе данных.
26Современная аналитика — это уже не просто дашборды. Рассказываем, почему бизнесу недостаточно видеть данные и как современные BI-платформы помогают быстрее принимать решения, автоматизировать действия и использовать возможности ИИ.
35Qlik сегодня — это уже не просто BI. На Qlik Community Uzbekistan 2026 участники обсудили будущее аналитики, облачные технологии, интеграцию данных и возможности Agentic AI. Делимся ключевыми выводами и инсайтами мероприятия.
16Почему высокая активность торговых представителей не всегда означает эффективную работу на территории? Рассмотрим ключевые показатели, практические сценарии и подход к управлению торговыми визитами на основе данных.
Warning: foreach() argument must be of type array|object, false given in /home/rbcgrp/rbcgrp.com/www/wp-content/themes/theme-sp/template/blog.php on line 374

The operations of virtually any business depend largely on having sufficient quantities of raw materials, supplies, and components, which are purchased from other companies. Even a small office requires equipment, furniture, communication tools, and other essentials. And for large businesses, procurement constitutes a significant portion of their operations.
A comprehensive procurement analysis helps optimize, partially automate, and simplify procurement processes. And RBC Group offers you comprehensive solutions for this task.
Procurement Analysis and the Company’s Logistics System
A procurement management system is a complex, multi-tiered structure that is built, in part, on the results of an analysis of the company’s procurement activities. It is designed in accordance with the established goals and objectives of procurement management.
The analysis itself typically consists of six components:
- Review of current procurement terms and the supplier market.
- Monitoring the company’s procurement budget.
- Comprehensive analysis of the company’s financial performance.
- Rigorous quality control of the products the company purchases.
- Monitoring the delivery process for materials, components, or finished products from suppliers.
- Analysis of the demand forecasting system.
Depending on the goals and objectives set, this list may vary. Some items are removed, while others are added. Optimizing the procurement process is a highly customized endeavor that requires a comprehensive approach and the implementation of modern solutions. RBC Group provides precisely these solutions.
How procurement analysis and optimization help businesses in practice
Let’s elaborate on the above and examine how these measures help optimize workflows at various levels.
For business owners and executives
Owners and executives can monitor the procurement department’s performance metrics at all levels, analyze procurement processes, reduce costs, gain a deeper understanding of the working conditions of suppliers and procurement managers, or review individual transactions.
All necessary information is displayed clearly and is easy to understand, and you can view it from various devices for even greater convenience. Review procurement plans, price changes, delivery deviations, metrics for different periods, and much more. And all of this—with a single convenient tool.
For category managers and buyers
For this category of users, procurement analysis is a useful tool for identifying misallocated funds, standardizing procurement managers’ work, reducing product defects, and preventing excess or shortages of materials, components, and other items in inventory.
With the RBC Group app, you can perform comparative and dynamic analysis to obtain more objective and accurate results and work with up-to-date data.
For IT Directors
Our procurement management system allows you to import data from various systems and sources, processes large volumes of information quickly, and supports scalability and deployment on Windows and Linux.
When changes are made, the analysis results are displayed as quickly as possible, enabling you to address business challenges more efficiently. We offer a truly flexible tool for independent analysis without the need to engage third-party specialists.
How analyzing procurement activities helps reduce costs and optimize business operations
Optimizing the procurement department’s operations is physically impossible without conducting a procurement analysis. This analysis helps address several key challenges:
•
- what to purchase;
- from whom to purchase;
- in what quantities to purchase;
- under what terms and conditions to purchase.
Once these challenges have been addressed, it is possible to establish an effective corporate logistics management system. This, in turn, provides the company with several critical advantages:
- It enables improved demand planning and resource allocation for those company departments directly involved in production.
- It makes it possible to reduce or even completely eliminate losses from defective products, as well as avoid losses of material resources during their transportation from suppliers.
- Significantly reduces production waste, allowing for the effective use of recycled materials in some cases.
- Eliminates intermediate warehousing in certain situations, thereby saving time and money on transportation from point A to point B.
- Optimizes logistics by allowing for the most efficient use of vehicles’ load capacity, reducing the number of deliveries while increasing their volume.
More importantly, optimizing procurement helps prevent shortages or surpluses of materials, raw materials, or components in the company’s warehouses. This optimizes the company’s overall operations and prevents unforeseen circumstances related to product shortages or surpluses.
Procurement Management at Your Company Using RBC Group Tools
We provide our clients with a preconfigured solution for analyzing the company’s procurement data across all necessary dimensions:
- suppliers and buyers;
- procurement plans;
- order-specific details.
You’ll be able to easily analyze the price and quantity of purchased SKUs (stock keeping units), product delivery times, the number of returns and defective items, and more.
Our solution is designed for business owners, company directors, managers, procurement specialists, and other key personnel involved in the workflow. RBC Group’s procurement management system is already being used across a wide range of industries: retail, FMCG, banking, agriculture, manufacturing, the restaurant industry, and more.
If you’d like to learn more about how procurement analytics is performed using RBC Group’s tools, submit a request on our website. Better yet, request demo access to the “Sales Analysis” application to personally evaluate its benefits and functional capabilities in practice.

