


Analysis of Production in Azerbaijan
The application enables users to analyze the production cycle: production capacity utilization, comparison of planned versus actual production, quality control and identification of defect causes, and cost analysis in Azerbaijan


What is the current status of the production plan by product and work area?

How consistently is the schedule being followed—is production being released evenly on a daily basis?

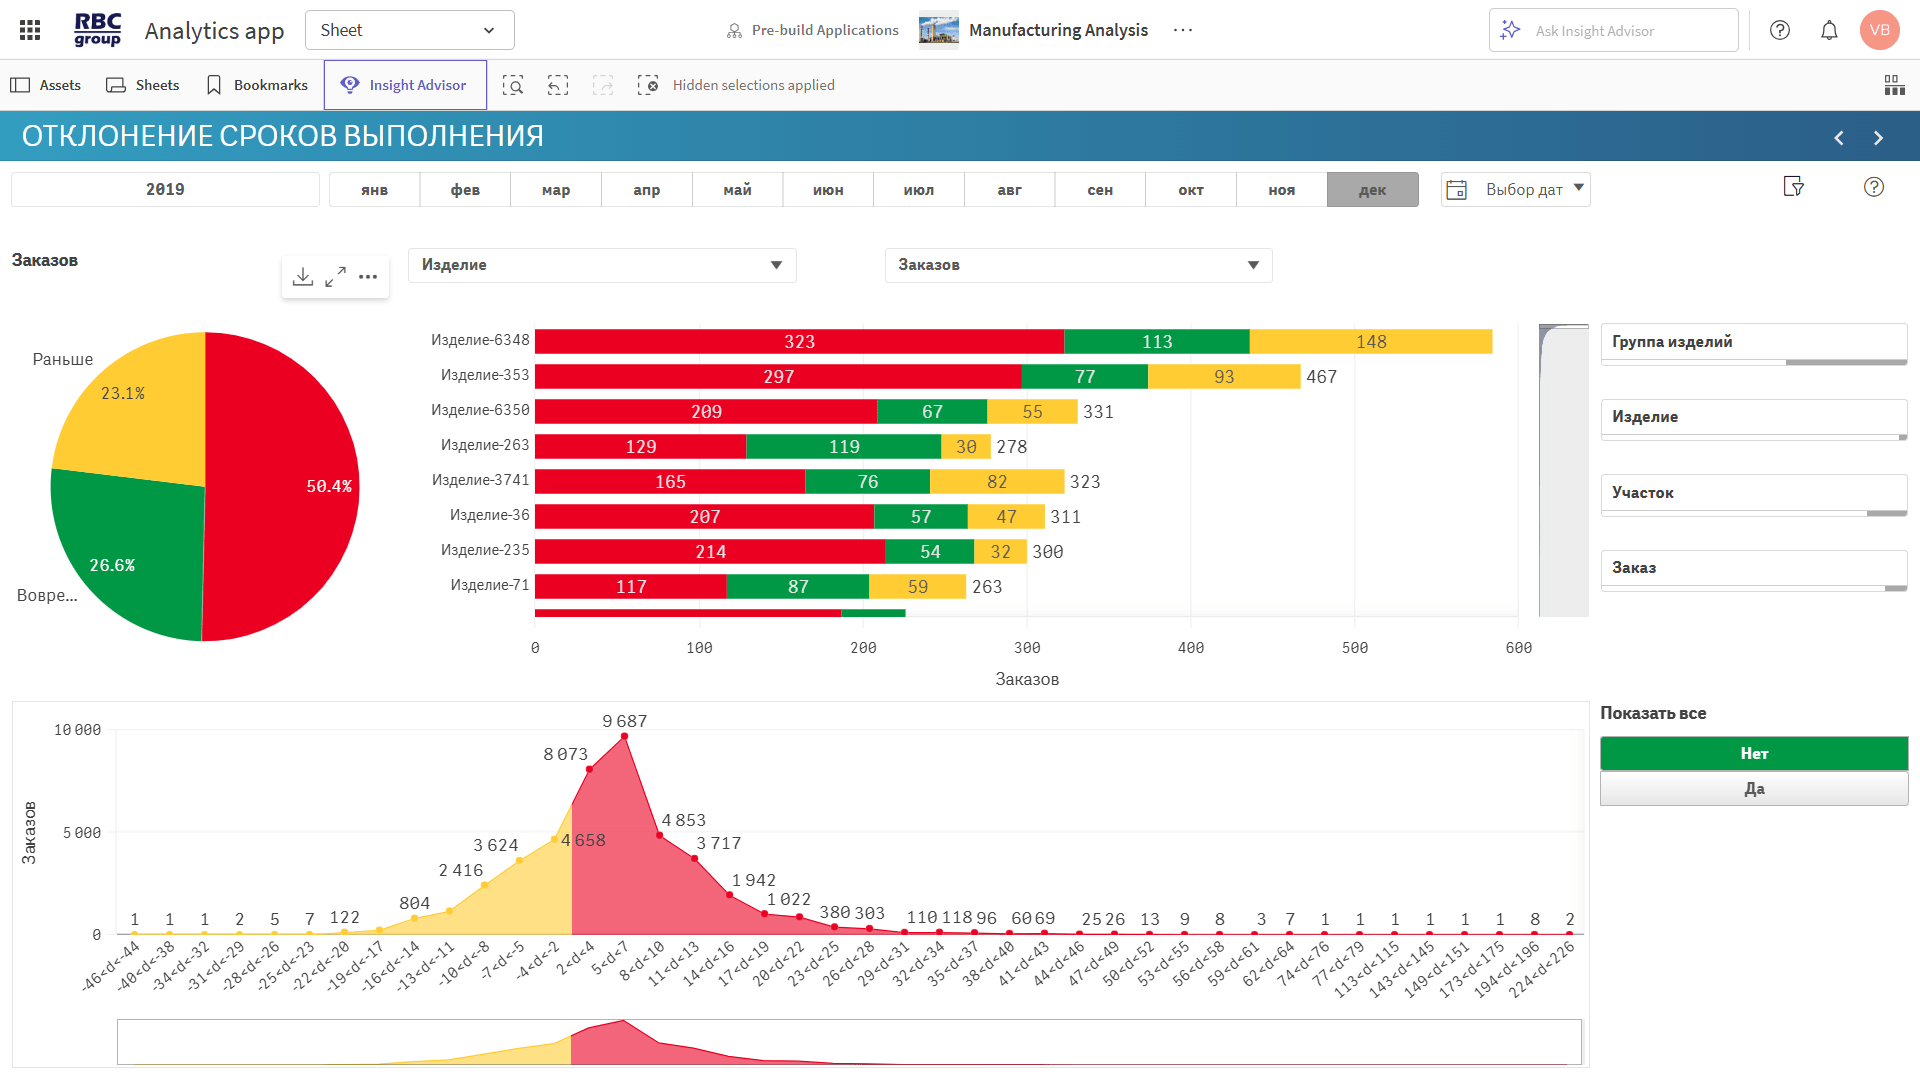
Where do deviations from the schedule occur: on time, late, or early?

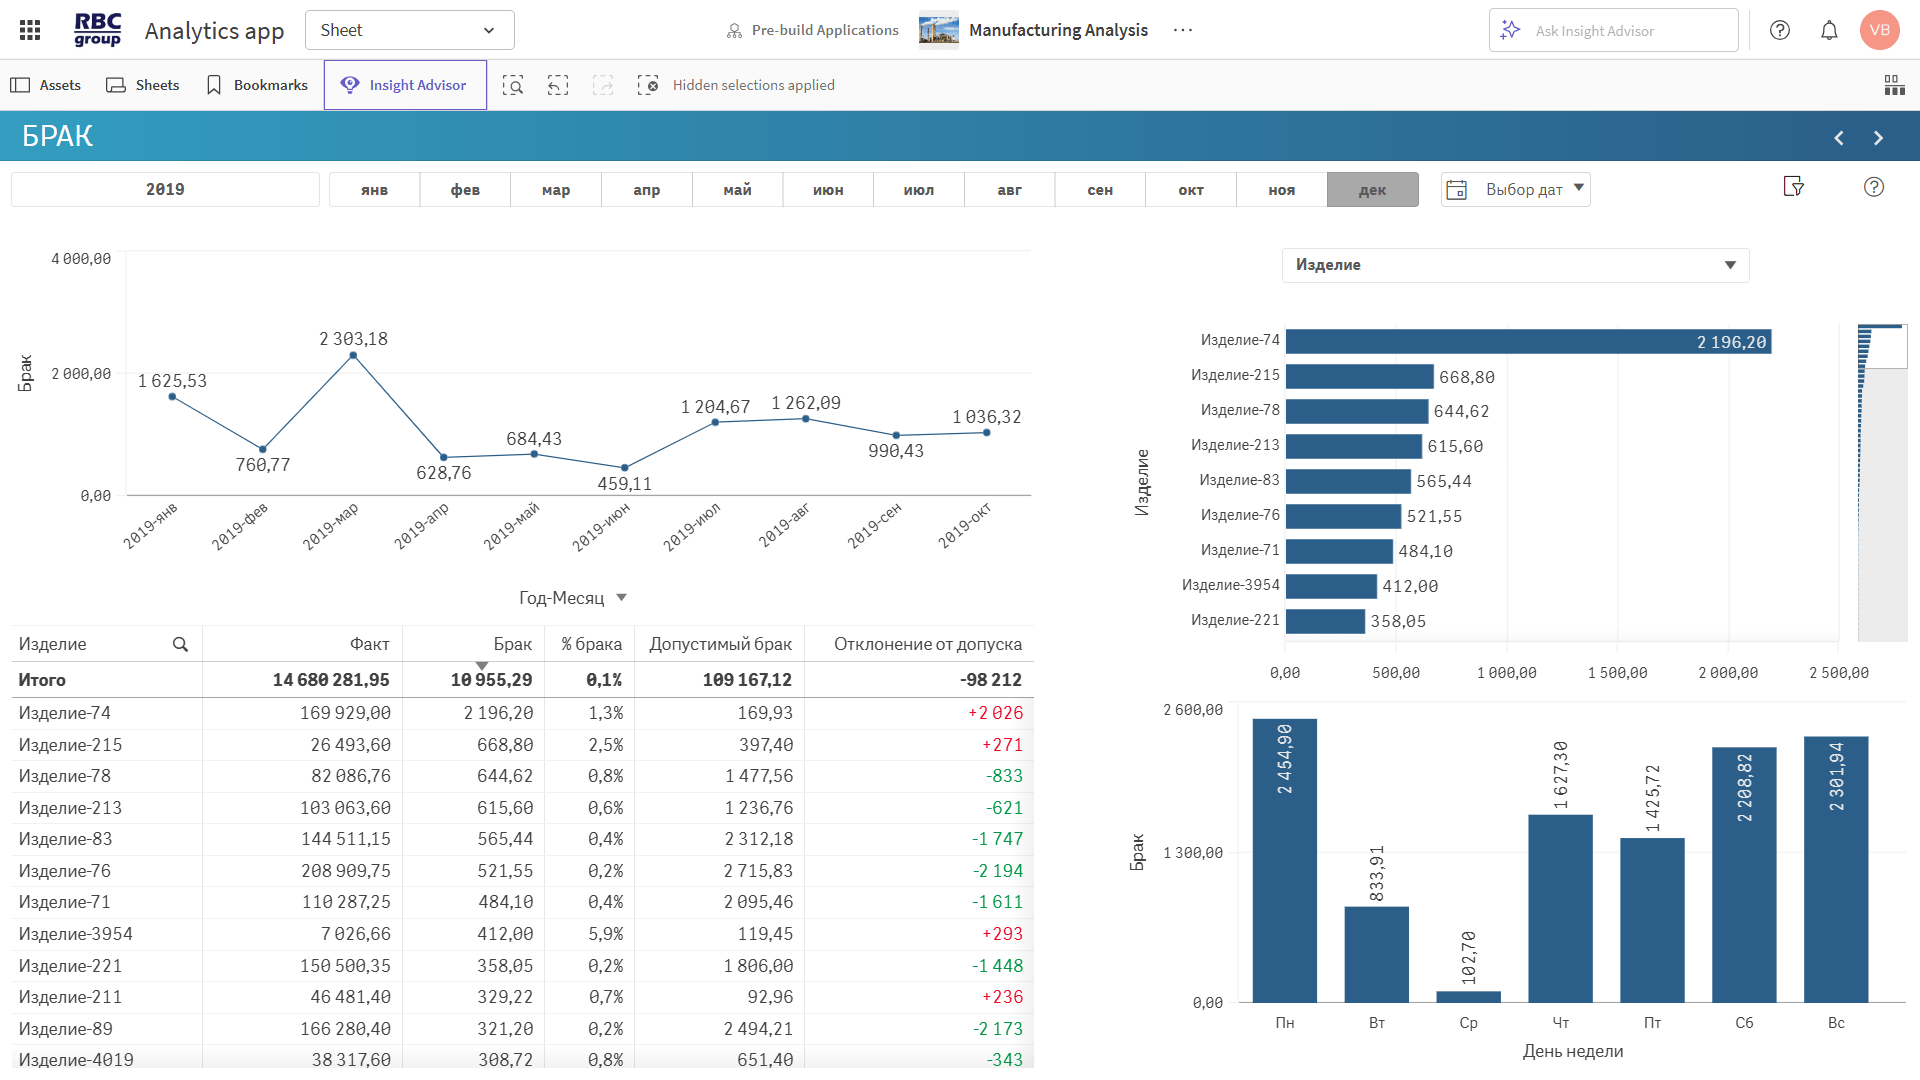
Which products or areas are most critical in terms of defects and shortages?

Where has the acceptable defect rate been exceeded?

How does the cost of goods vary by period and group?

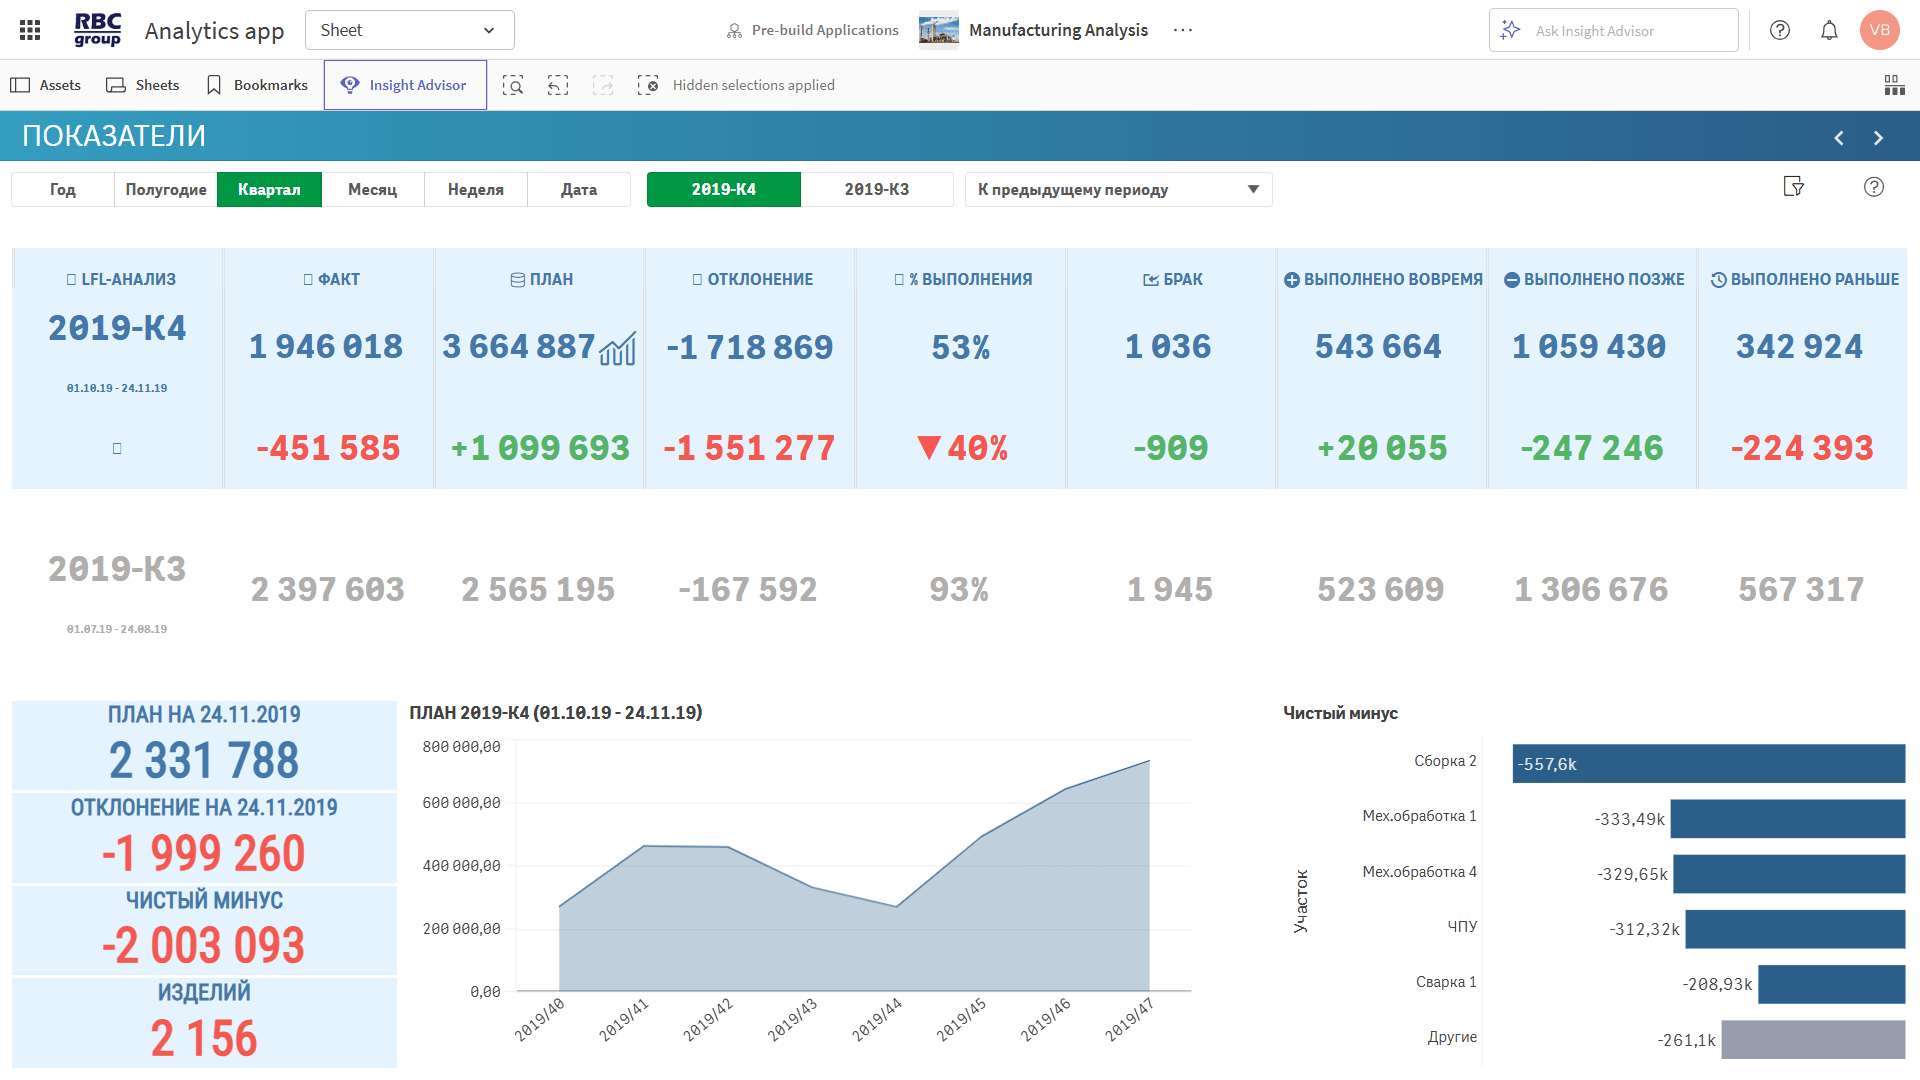
What are the projected figures for plan completion at the end of the period?

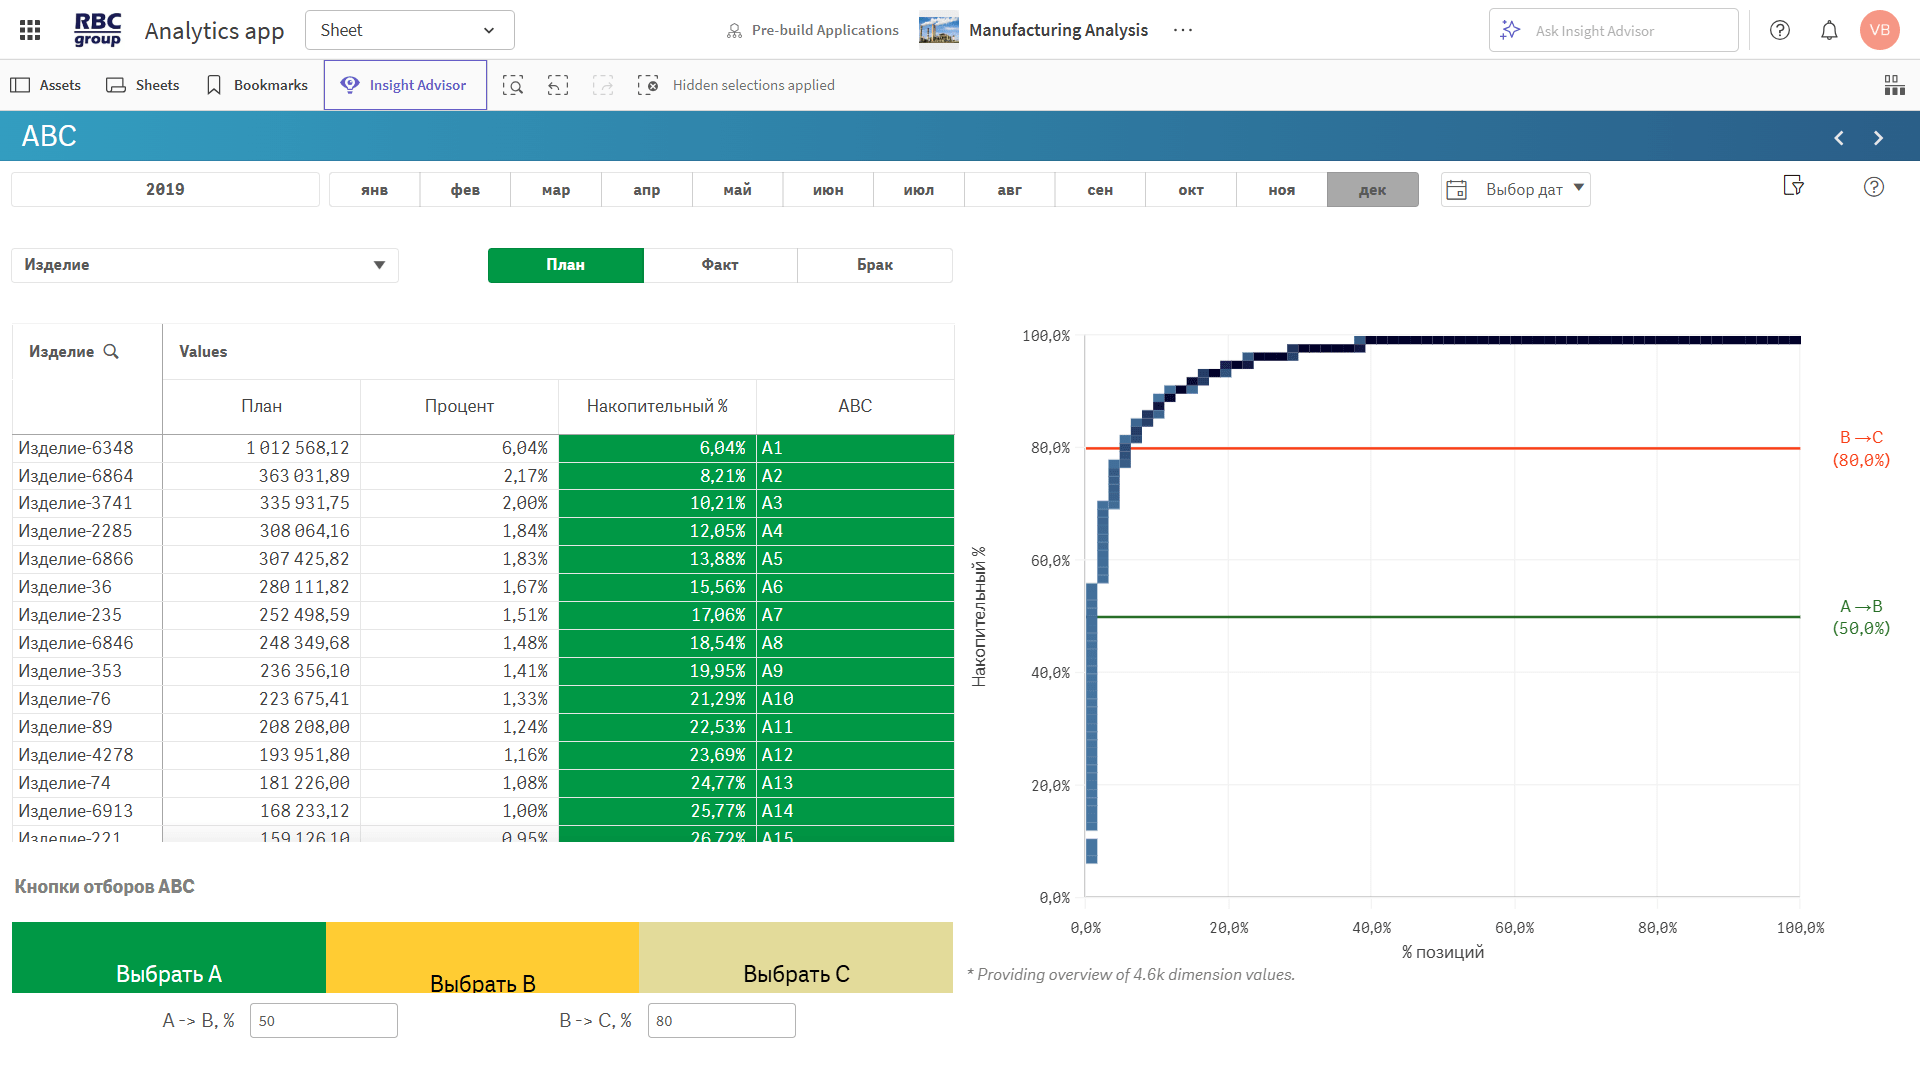
Which products account for the bulk of production and impact the overall results?

Where does the net shortfall occur (target > actual)?
How has production performance changed compared to last year (LFL analysis)?

Which departments consistently exceed or fall short of their targets?
What percentage of products are delivered exactly on time?

This preconfigured solution enables you to perform plan-versus-actual, dynamic, percentage-based, ranking, and ABC analyses of the production process for a company or group of companies. Monitor the fulfillment of production plans for the enterprise as a whole and broken down by individual workshops, finished goods, semi-finished goods, and production orders. Analyze production dynamics and discipline, delays and early completion of orders, and the number of canceled orders
They evaluate the fulfillment of the production plan and identify any deviations.
◾ Plan, Actual, Variance, % Completion
◾ Completed on time / late / early
◾ Net shortfall (deficit)
◾ Defects, % Defects, Acceptable Level, Variance
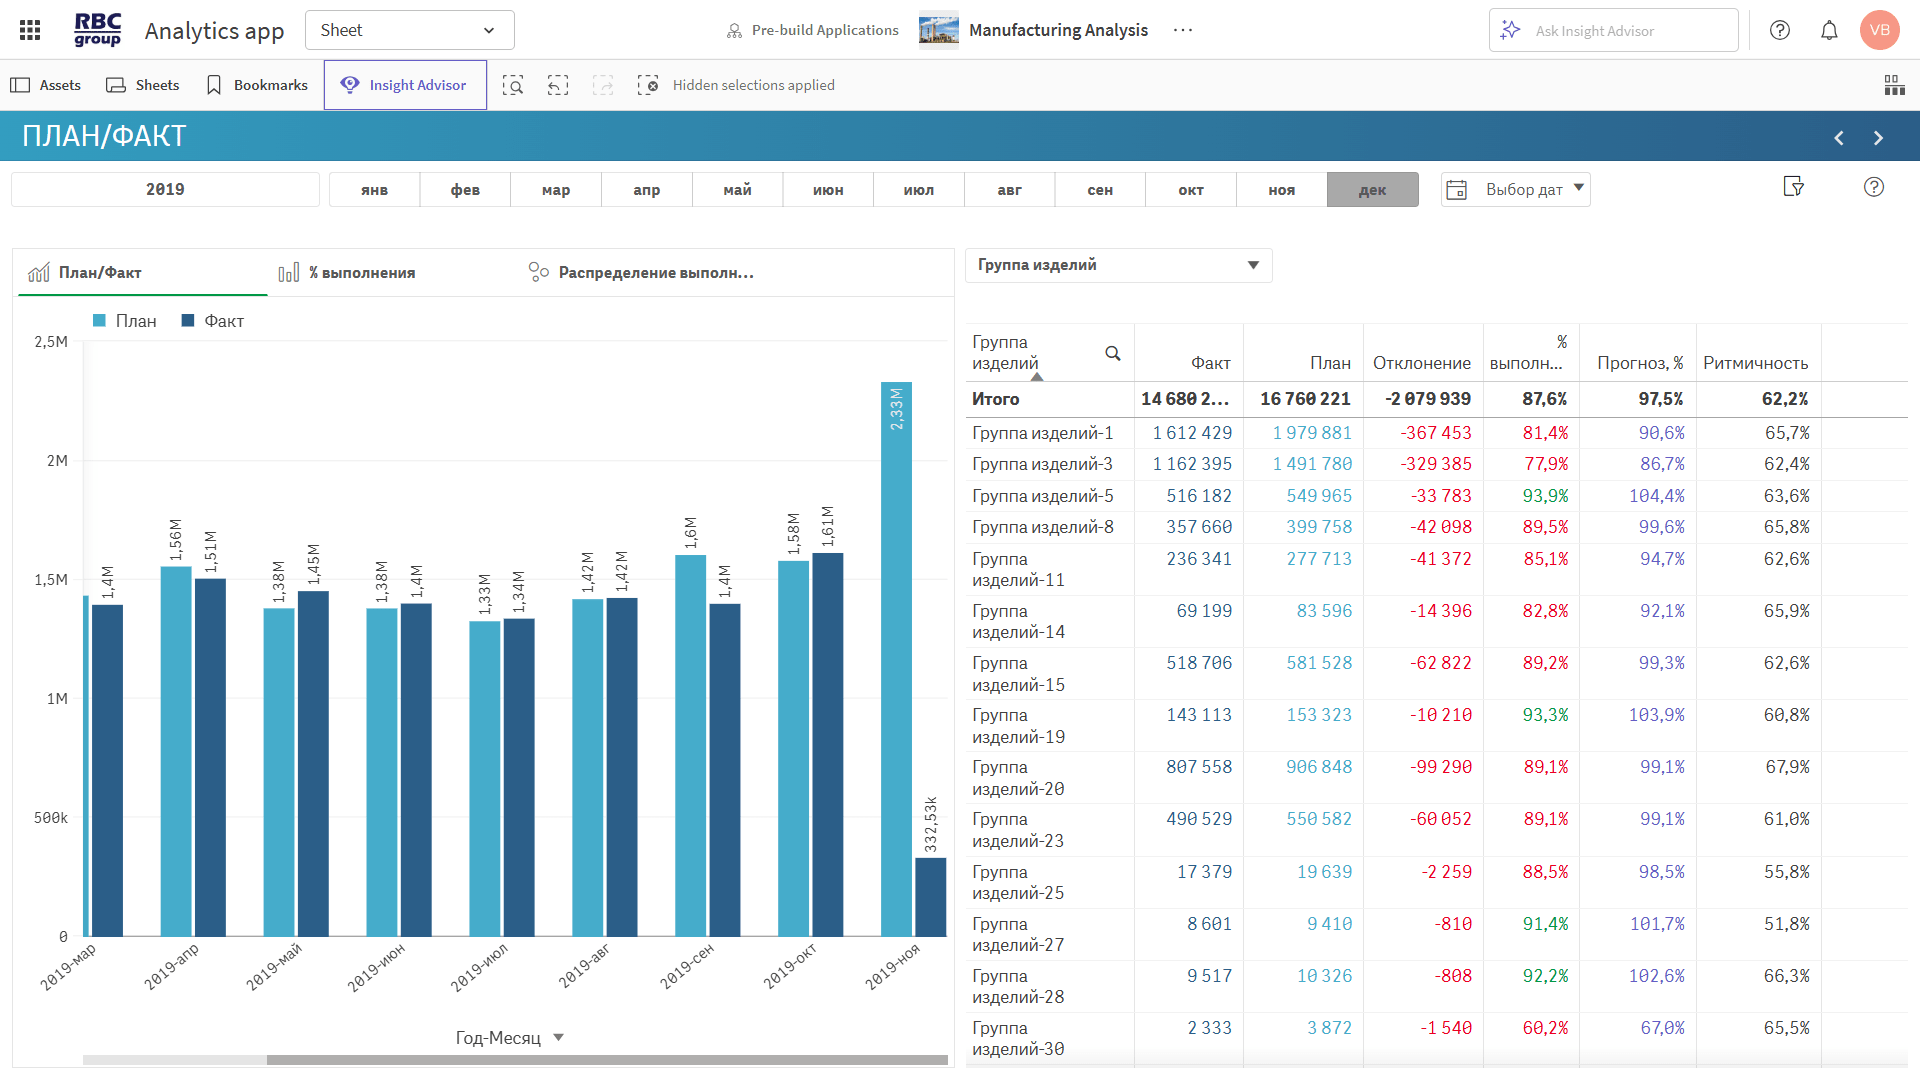
Production is shown in monetary and physical terms.
◾ Display in currency and units of production
◾ Budget vs. actual in monetary terms and quantity, with format switching
They track the timely completion of plans and adherence to the schedule.
◾ Performance by time period: year, quarter, month, week
◾ Deviations from deadlines (in days)
◾ Percentage of orders fulfilled exactly on time
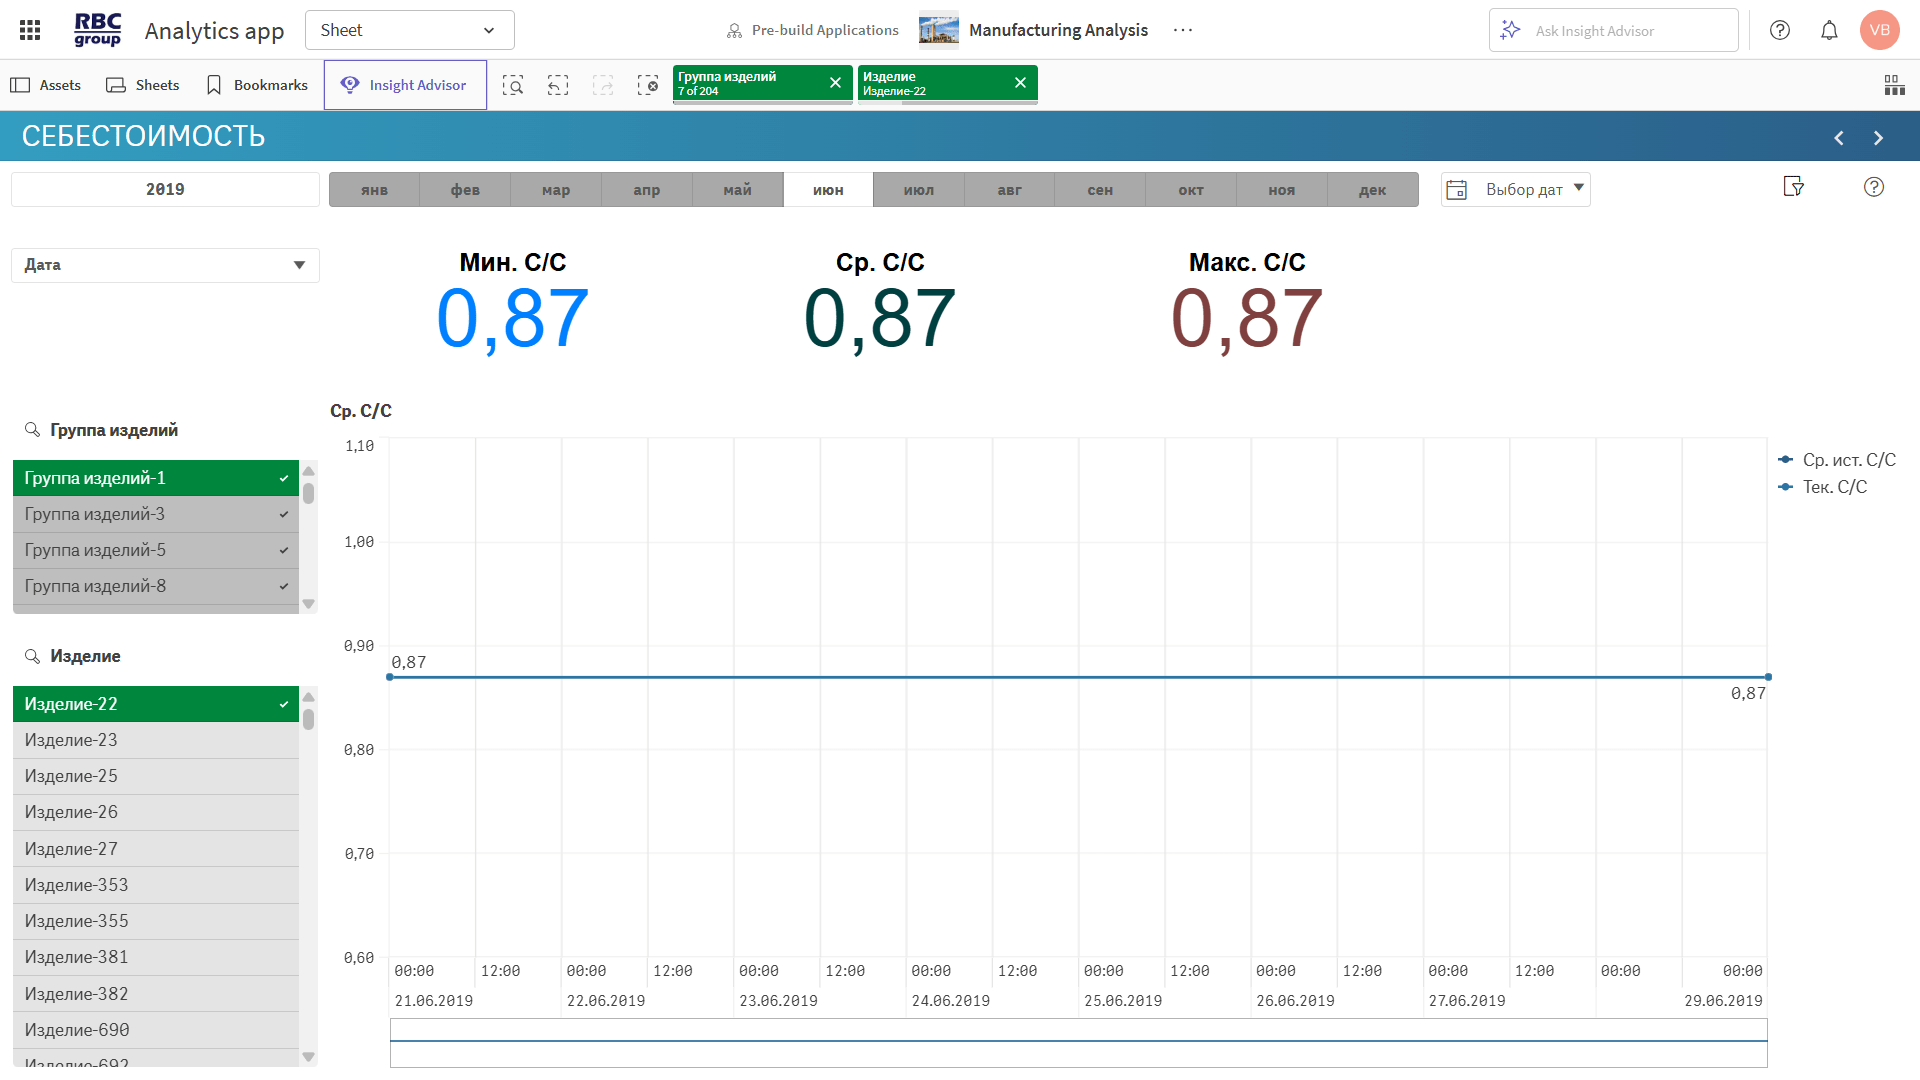
They enable the analysis of production's financial performance.
◾ Historical and current cost of goods sold
◾ Cost of goods sold trends by product and group
◾ Minimum, maximum, and average cost of goods sold for the period
They assess the extent and causes of losses in the production process.
◾ Defect volume and structure
◾ Actual vs. acceptable level
◾ Variations by section, product, and product type
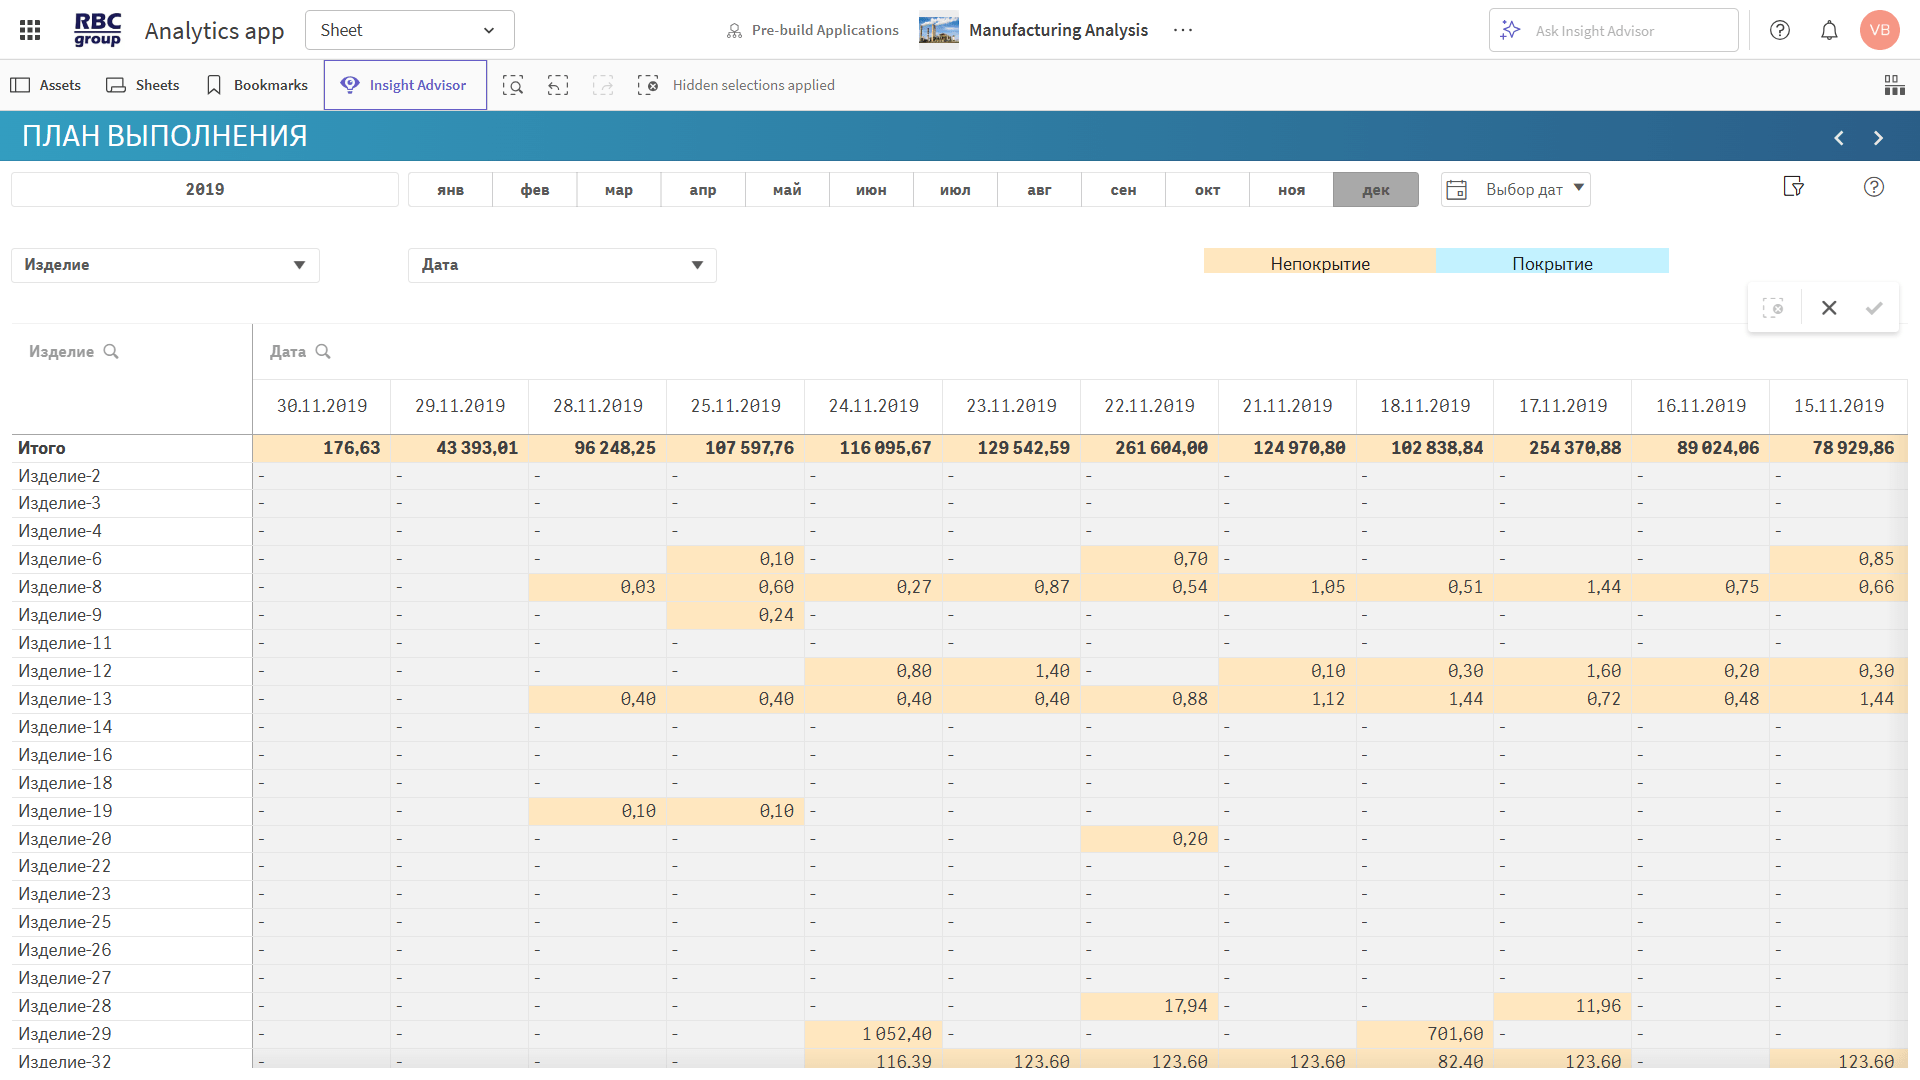
They analyze the consistency of plan execution by day and by section.
◾ Rhythm coefficient
◾ Percentage of days with overachievement
They are used to identify priorities and analyze effectiveness.
◾ ABC analysis by product, department, and product type
◾ Over- and under-performance ratings
◾ LFL analysis by period and structure
◾ Visualization builder and customizable charts
Our solution tracks the progress of the production plan, forecasts results at the end of the period, and highlights deviations in terms of timing and volume.
This helps improve discipline and identify the risk of underperformance in a timely manner.
Metrics tracking changes in production costs, defect rates, and their deviations enable companies to monitor production costs and identify the causes of losses.
The result is reduced costs and improved financial performance.
You can drill down to the product, work area, or time period, and use ABC analysis, rankings, LFL, and customizable charts to make management decisions.
This ensures transparency and manageability at all levels of production.


RBC Group enhances its clients' competitiveness by implementing modern business analytics, data integration and management, artificial intelligence, and advanced analytics systems.


 26
26Современная аналитика — это уже не просто дашборды. Рассказываем, почему бизнесу недостаточно видеть данные и как современные BI-платформы помогают быстрее принимать решения, автоматизировать действия и использовать возможности ИИ.
 35
35Qlik сегодня — это уже не просто BI. На Qlik Community Uzbekistan 2026 участники обсудили будущее аналитики, облачные технологии, интеграцию данных и возможности Agentic AI. Делимся ключевыми выводами и инсайтами мероприятия.
 16
16Почему высокая активность торговых представителей не всегда означает эффективную работу на территории? Рассмотрим ключевые показатели, практические сценарии и подход к управлению торговыми визитами на основе данных.
26Современная аналитика — это уже не просто дашборды. Рассказываем, почему бизнесу недостаточно видеть данные и как современные BI-платформы помогают быстрее принимать решения, автоматизировать действия и использовать возможности ИИ.
35Qlik сегодня — это уже не просто BI. На Qlik Community Uzbekistan 2026 участники обсудили будущее аналитики, облачные технологии, интеграцию данных и возможности Agentic AI. Делимся ключевыми выводами и инсайтами мероприятия.
16Почему высокая активность торговых представителей не всегда означает эффективную работу на территории? Рассмотрим ключевые показатели, практические сценарии и подход к управлению торговыми визитами на основе данных.
Warning: foreach() argument must be of type array|object, false given in /home/rbcgrp/rbcgrp.com/www/wp-content/themes/theme-sp/template/blog.php on line 374

Production Analysis
Production efficiency is the ultimate goal of any manufacturing company. It involves maximizing the optimization and utilization of all available resources, fulfilling orders on time, and reducing unnecessary costs and defects. Achieving this goal is complicated by the fact that manufacturing companies generate massive amounts of data, much of which simply goes unused due to limited technical capabilities. Modern analytics platforms and pre-configured solutions, such as the “Production Analytics” application, aggregate large volumes of data and provide businesses with easy access to valuable information that can be used for operational tasks and strategic planning.
The software collects information from multiple sources and leverages machine learning models and visualization platforms to demonstrate new ways to optimize the processes under study.
Why Business Analytics Is Essential for Monitoring Operational Efficiency
The complexity of production process control lies in its multi-tiered nature. Each stage of production must be planned, taking into account technical nuances, delays, and the amount of defective products. At the same time, the company’s individual departments are closely interconnected and interdependent.
An analysis of production efficiency covers all stages of product creation and includes:
- assessing the efficiency of equipment use;
- monitoring progress toward targets;
- monitoring product quality;
- investigating the causes of defects;
- analyzing costs.
The analysis process is complicated by the size of the product range, the variety of product specifications and models, and constantly changing targets. Data streams from production and warehouse accounting, as well as the finance and marketing departments, form a network of critical information. This information must not only be collected but also processed promptly, enabling timely responses to deviations from targets, changes in trends, and fluctuations in the volume of defective products.
Manually analyzing production efficiency becomes even more complex as companies scale up production volumes, expand their product range, implement innovations, change suppliers, and hire and retrain employees. It is often difficult for managers to see the full picture of the changes that have taken place. As a result, a modernization initiative that affects a single department may fail to yield tangible positive results at the company-wide level due to the growing lag in other departments. Visibility of all processes at the enterprise level allows for consideration of the interdependencies between them, enabling the anticipation of resource shortages and a timely response to them.
How business analytics impacts production efficiency
The ultimate goal of analyzing a company’s operational efficiency is to maximize the bottom line—profit. Modern BI tools help achieve this goal by providing a reliable and comprehensive information base that enables fact-based decision-making:
- analyze the volume of defective products, track the causes of defects, and identify opportunities to reduce them;
• monitor all stages of production;
• track deviations from production plans by overall metrics, specific products, production stages, or departments;
• create rankings, identifying priority products, products with the highest defect rates, production volumes, order sizes, or deviations from plans;
• monitor the achievement of established KPIs.
Depending on the objectives set, an analysis of production efficiency may be based on an examination of:
- physical output volumes;
- product range;
- performance of individual departments;
- production consistency;
- product quality;
- achievement of targets.
Having a reliable business analytics solution will make the manufacturing process more manageable and increase revenue. A major advantage of modern platforms is that production efficiency is analyzed through a centralized repository, as opposed to a situation where different departments maintain their own reports and information is stored in silos. A shared database improves accessibility, reveals interdependencies, and draws management’s attention to underperforming units. At the same time, individual departments can still use charts and dashboards to gain deep insights into and analyze their own operations. Providing data to all departments reduces wait times for report requests and boosts the productivity of teams, who can track their key performance indicators, make decisions, or seek assistance if they are at risk of missing their targets.
Managers and business owners gain the ability to conduct a comprehensive review of the company’s core operations and to examine in detail the performance of specific departments or units. Analyzing production efficiency helps ensure discipline, identify high-performing managers, and motivate underperforming staff.
This analytical solution enables organizations to maximize the value of the data collected during the production process, helping to identify issues that arise at various stages of the manufacturing cycle and uncover hidden bottlenecks or suboptimal processes.

