


Analysis of Primary and Secondary Sales in Azerbaijan
The application helps improve the accuracy of initial sales forecasts, enhance procurement and production planning, and consolidate information across the entire supply chain by analyzing secondary sales in Azerbaijan


What are the volumes of primary and secondary sales in monetary and unit terms?

What are the key discrepancies between the plan, actual results, and forecast for primary and secondary sales?

What inventory is currently held in the company's warehouses and by distributors, and how many days of sales does it cover?

How is data on secondary sales from distributors consolidated, and how timely and accurate is it?

How does the current inventory level affect the achievement of the resale plan?

Which items generate cascading inventory: those that have been received but not sold?

Which items are out of stock but still in inventory—and vice versa?

Which SKUs are showing growth or decline in the LFL analysis?

What are the margins and markups by channel, product, and customer?

What are the key drivers of margin changes: price, cost, or volume?

What inventory and stock levels at distributors are hindering resale?

Where are we losing market share, and which products are missing from our product range?

This preconfigured solution enables a comprehensive 360° analysis of primary and secondary sales for any selected period based on any combination of filters: products, product segment, brand, packaging, organization, territory manager, supervisor, sales representative, customer, customer type, etc. It also allows you to assess inventory levels at the company and at distributors to analyze the ability to meet actual demand in secondary sales
Assess volumes, profitability, and shipment plan fulfillment.
◾ Quantity, total amount, cost of goods sold, margin, markup
◾ Margin %, Markup %
◾ Plan fulfillment, absolute deviation
◾ Plan / Actual / Forecast by volume
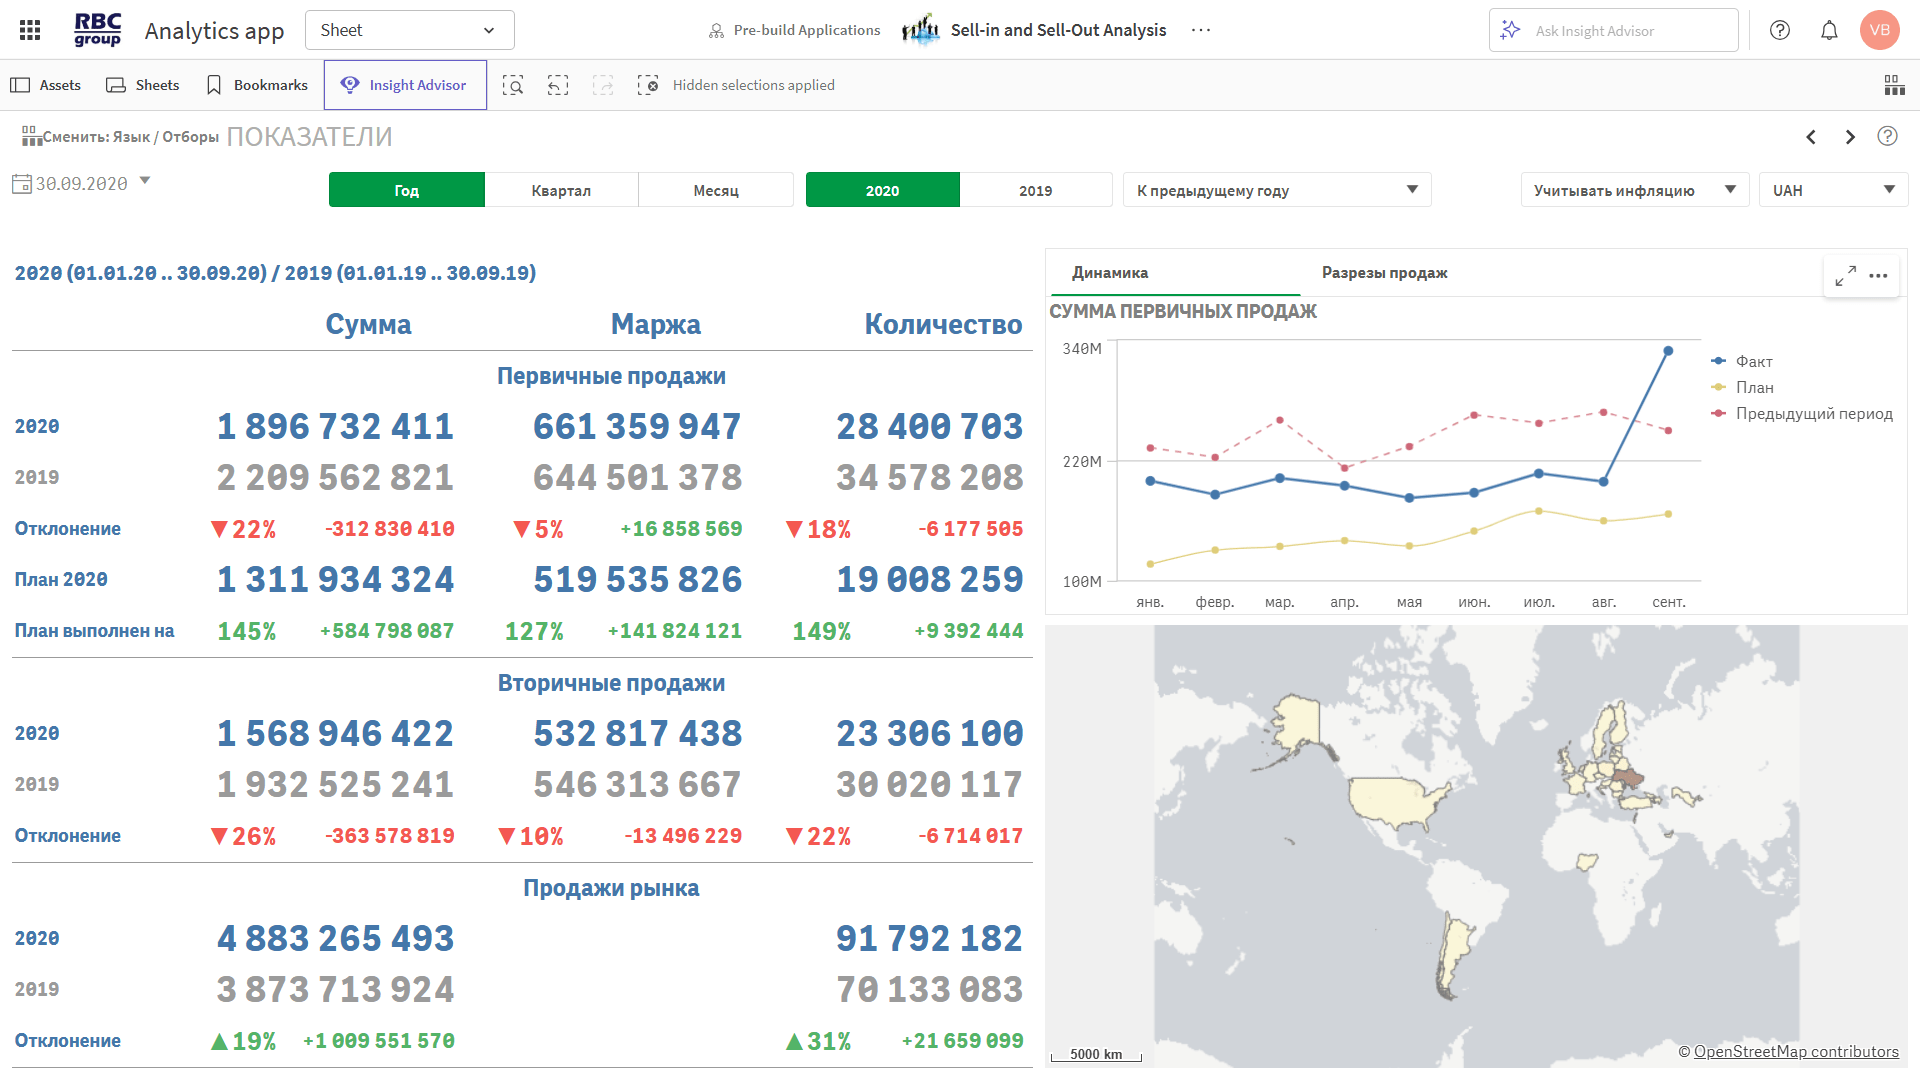
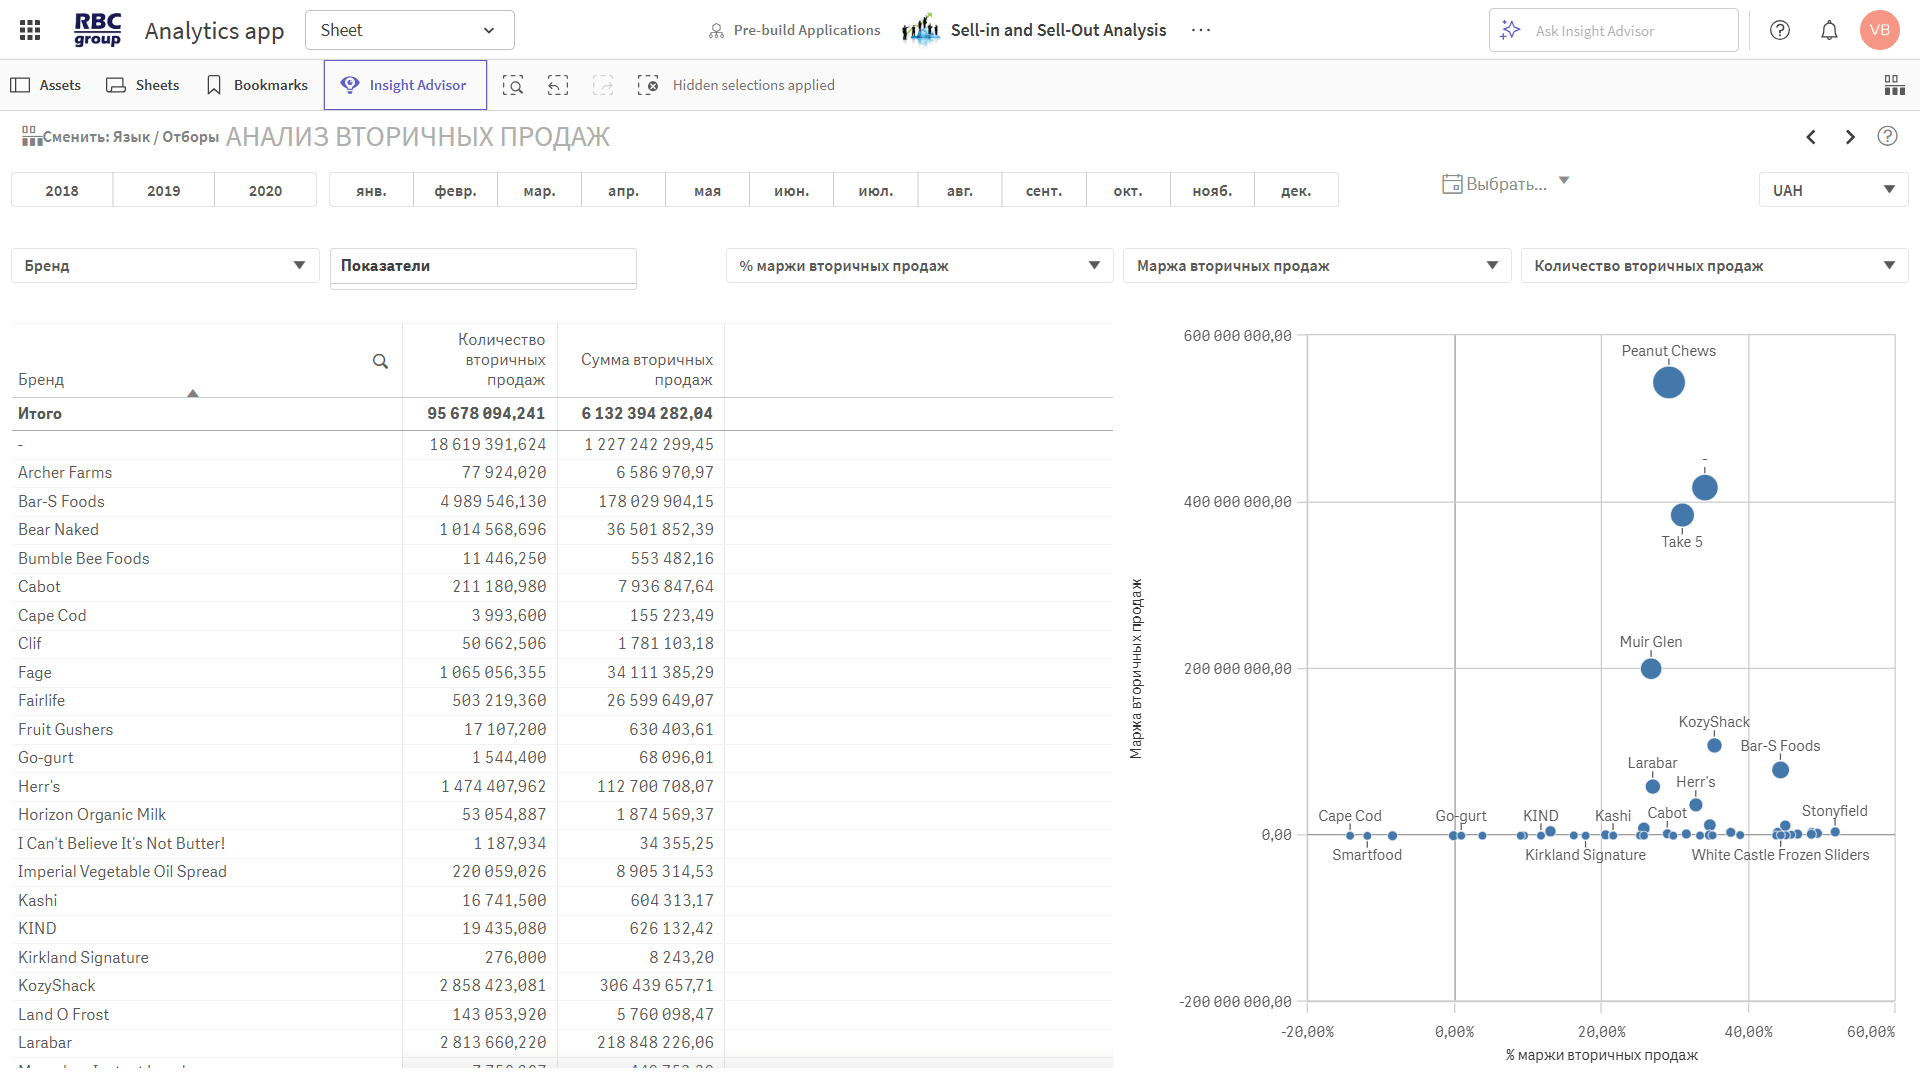
Displays sales performance at distributors and inventory levels affecting shipments.
◾ Secondary sales volumes: quantity, amount, cost of goods sold, margin
◾ Inventory at warehouses and distributors
◾ LFL variances for secondary sales
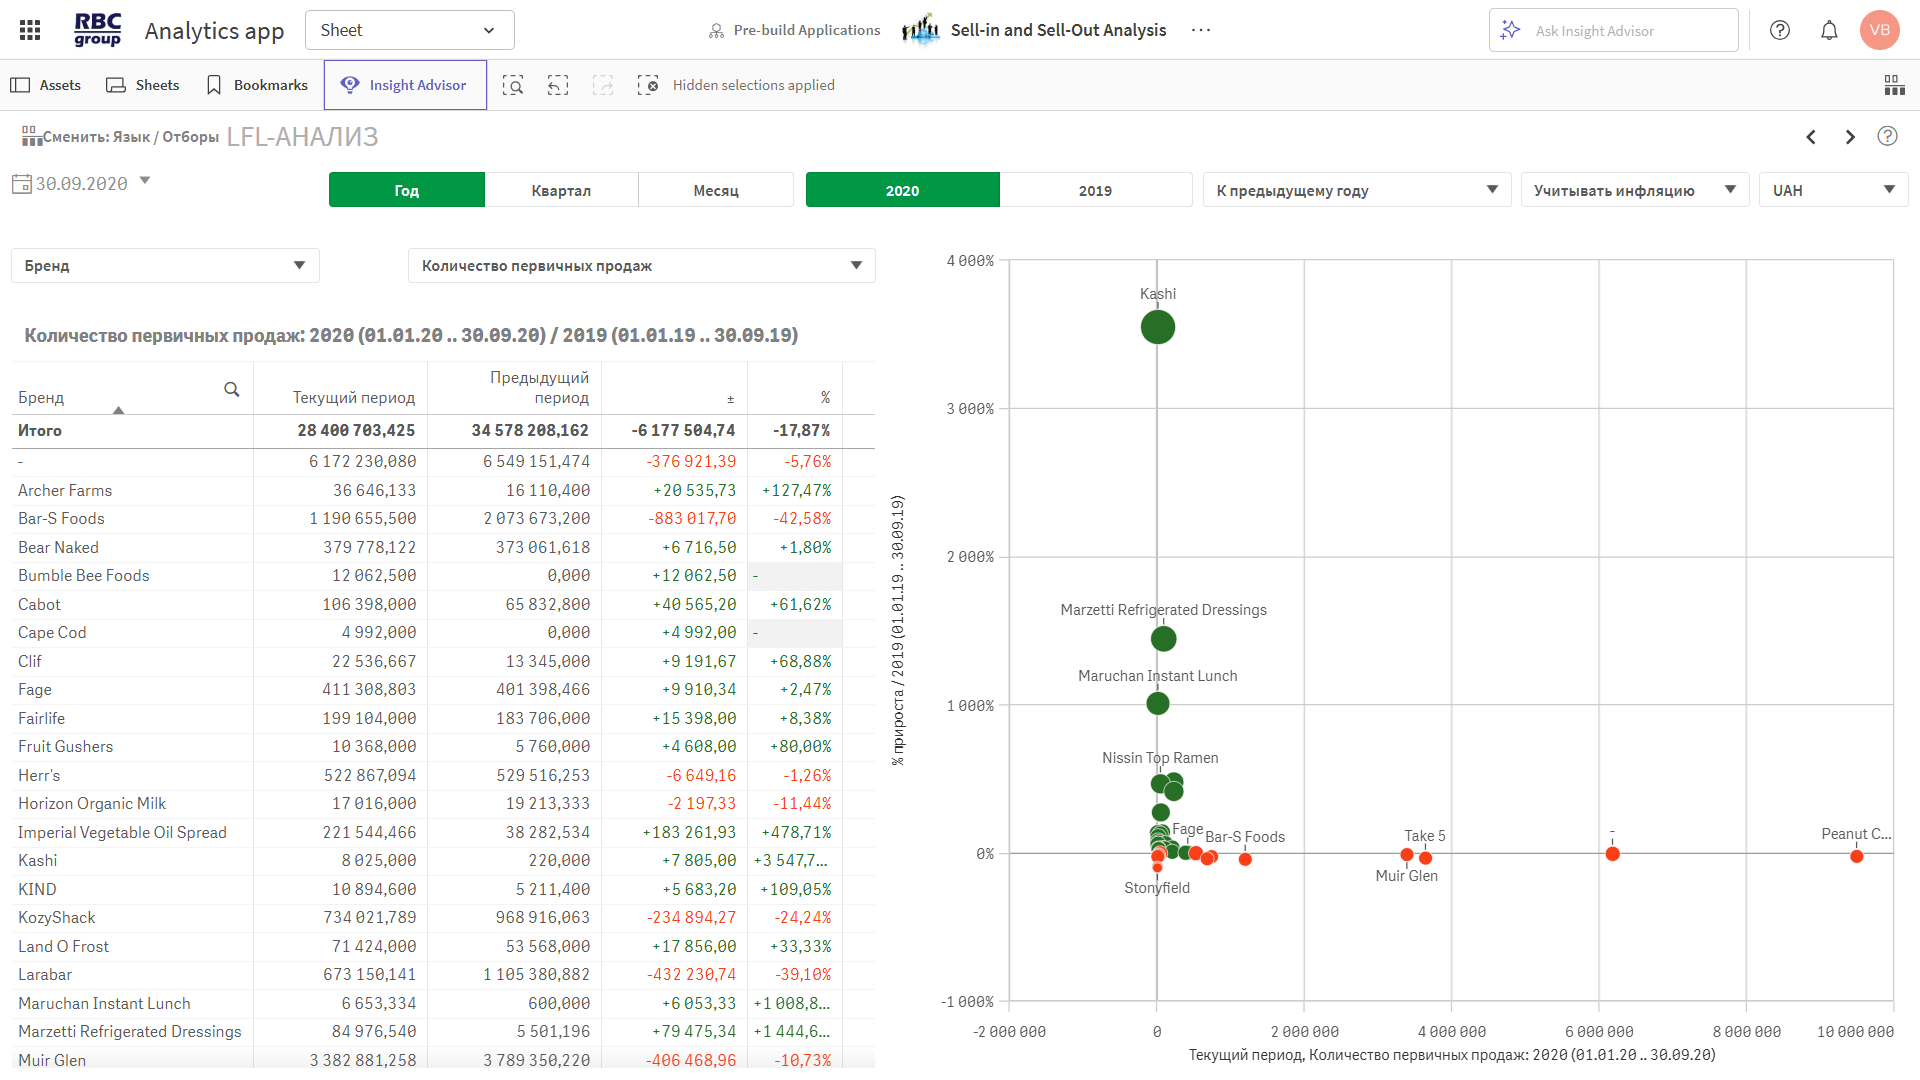
Help identify the causes of changes in margins and sales.
◾ LFL analysis by channel, region, and category
◾ Factor analysis: price, cost of goods sold, volume
◾ Comparison with the previous period and the same period last year
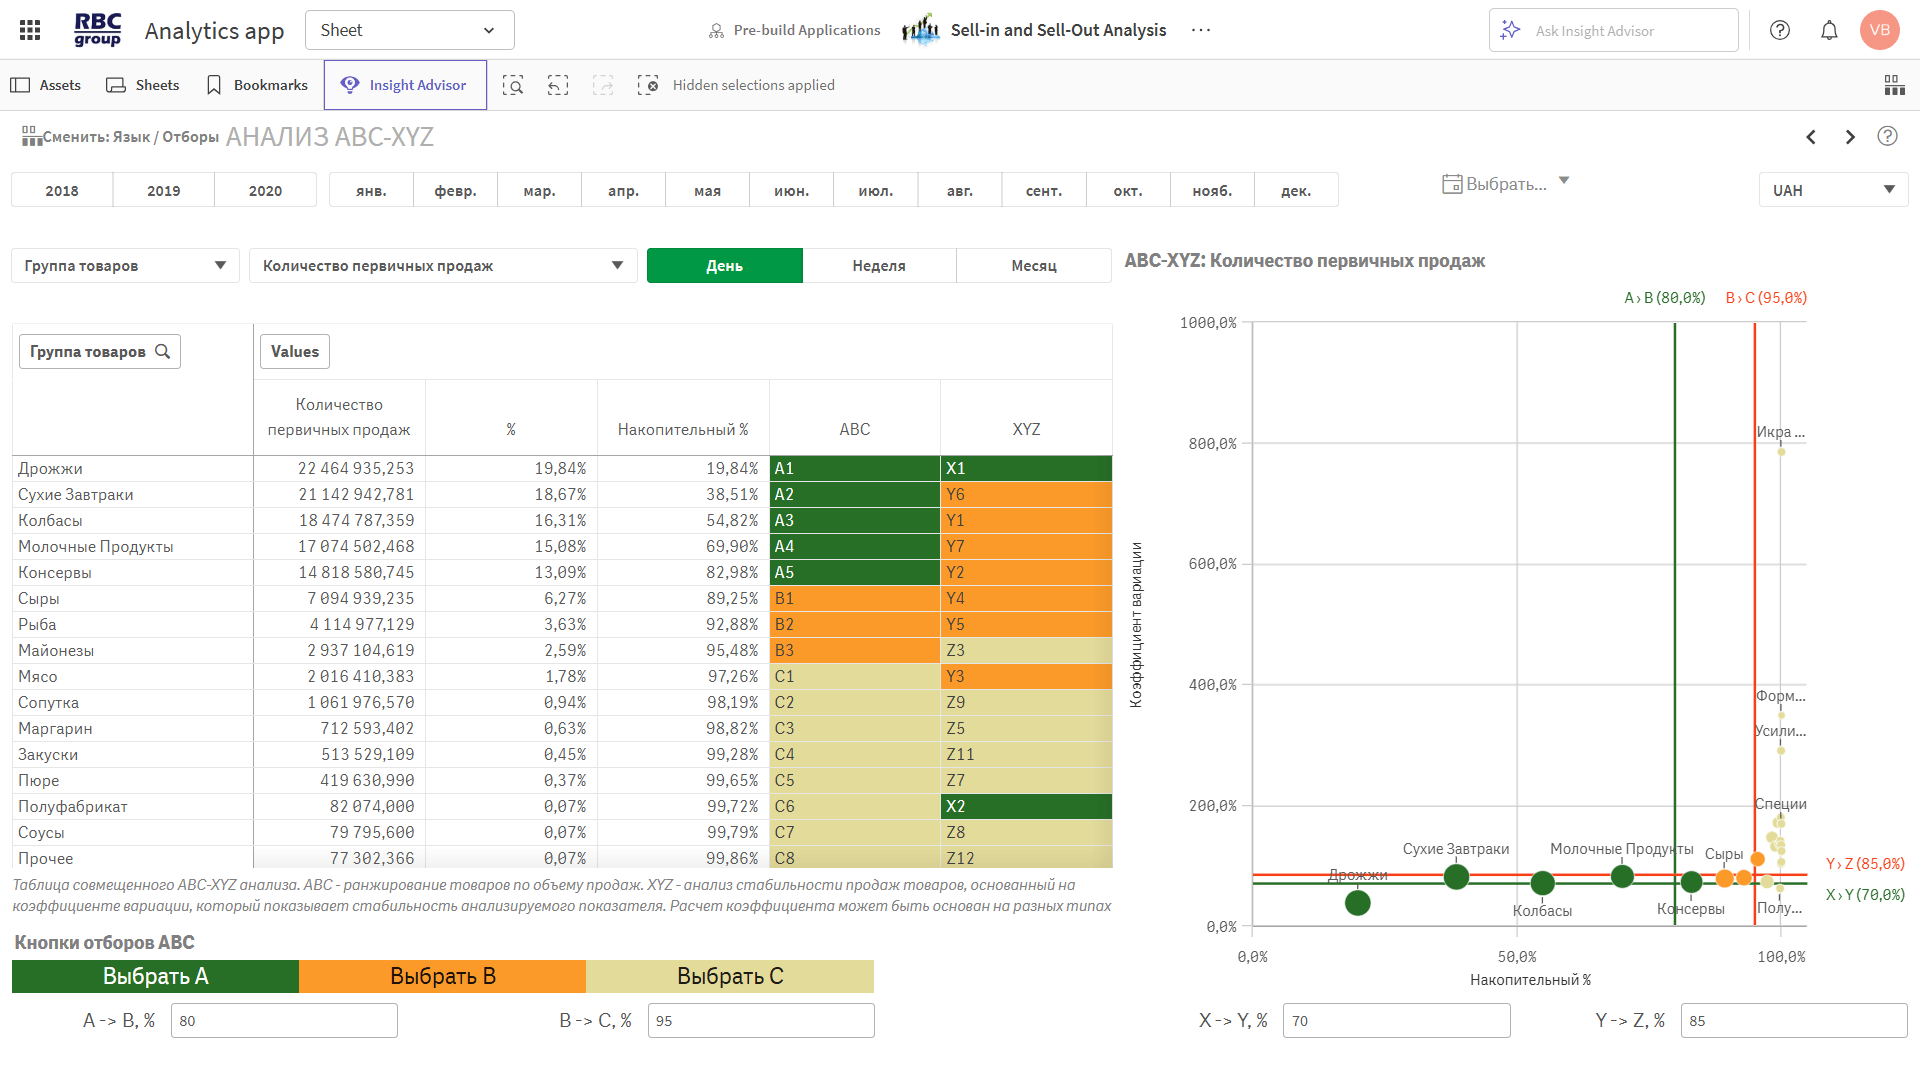
They evaluate the stability, frequency, and contribution of products to sales.
◾ ABC analysis: by value, quantity, and margin
◾ XYZ stability analysis
◾ FMR analysis of purchase frequency
Shows the distribution of sales and activity by channel and region.
◾ Sales by region, county, and GPS location
◾ Channel structure: retail, distribution, e-commerce, etc.
◾ Customer and product segmentation
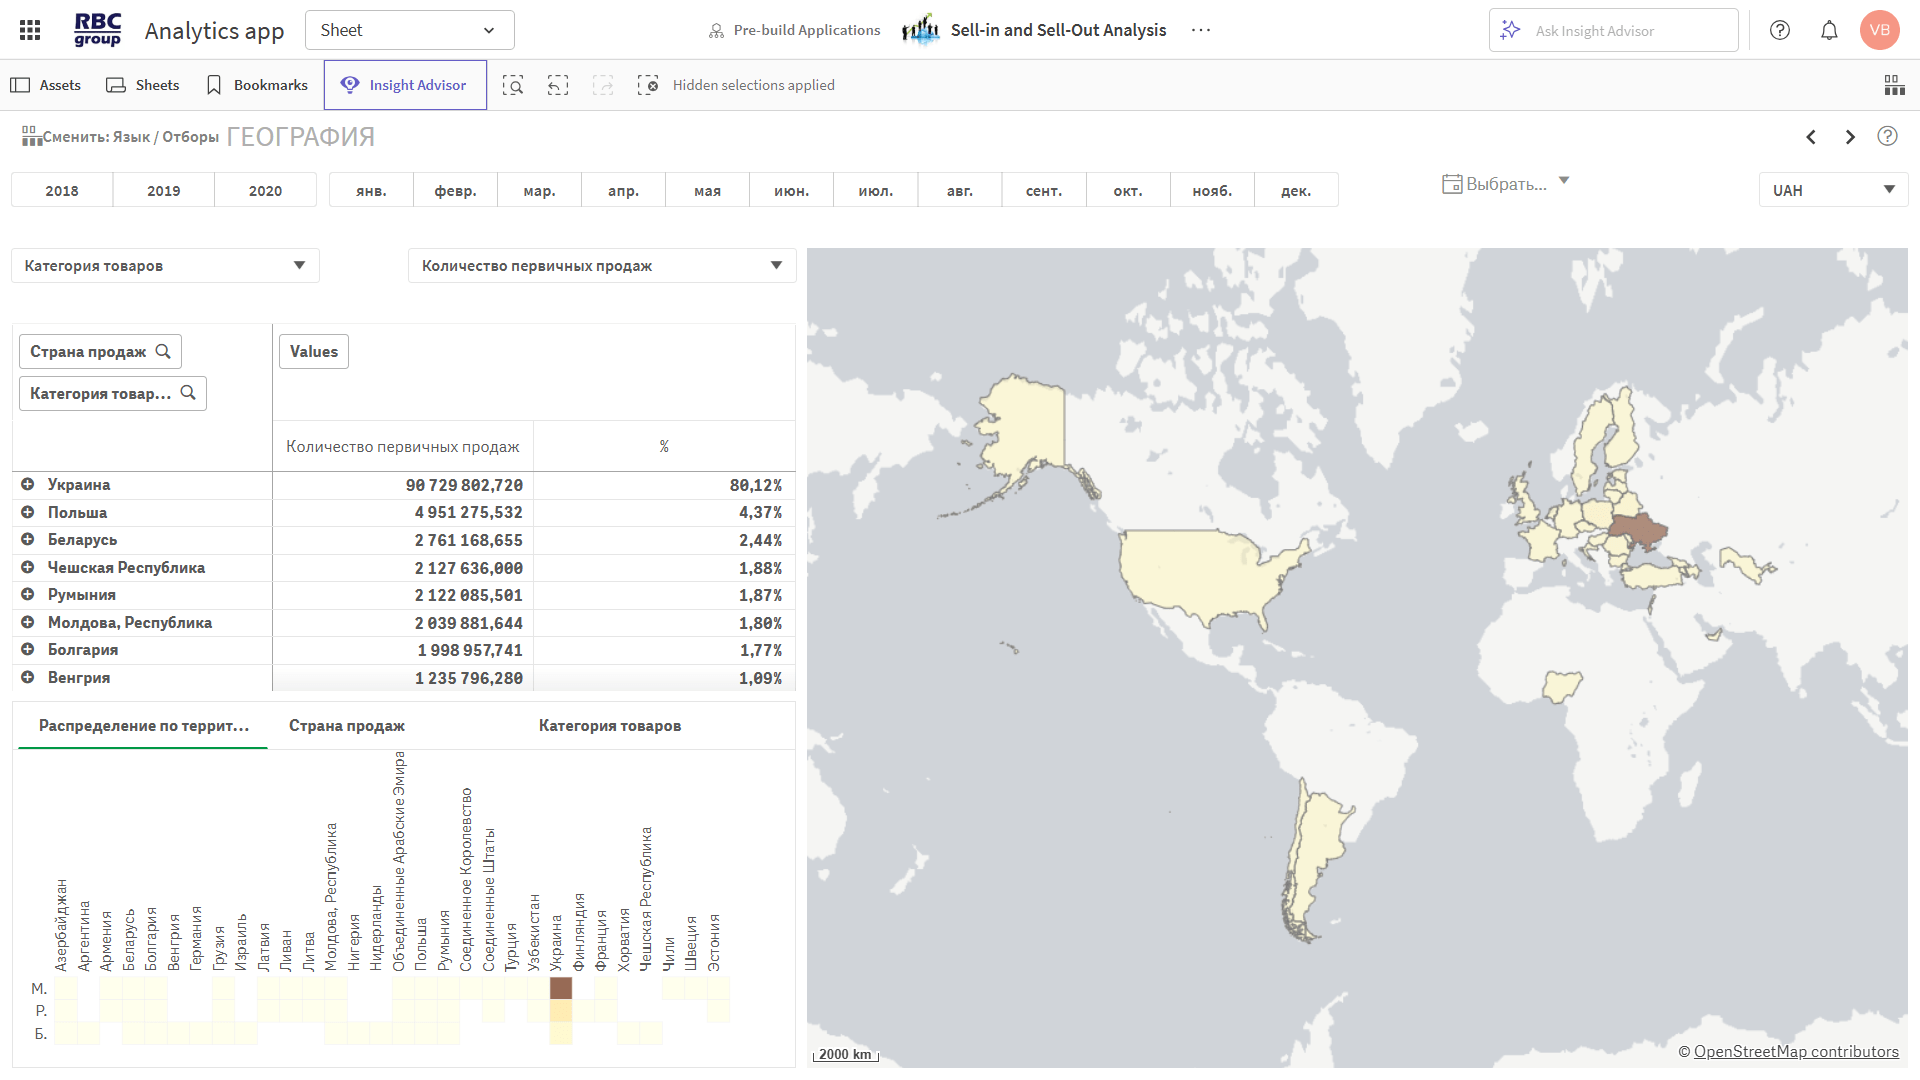
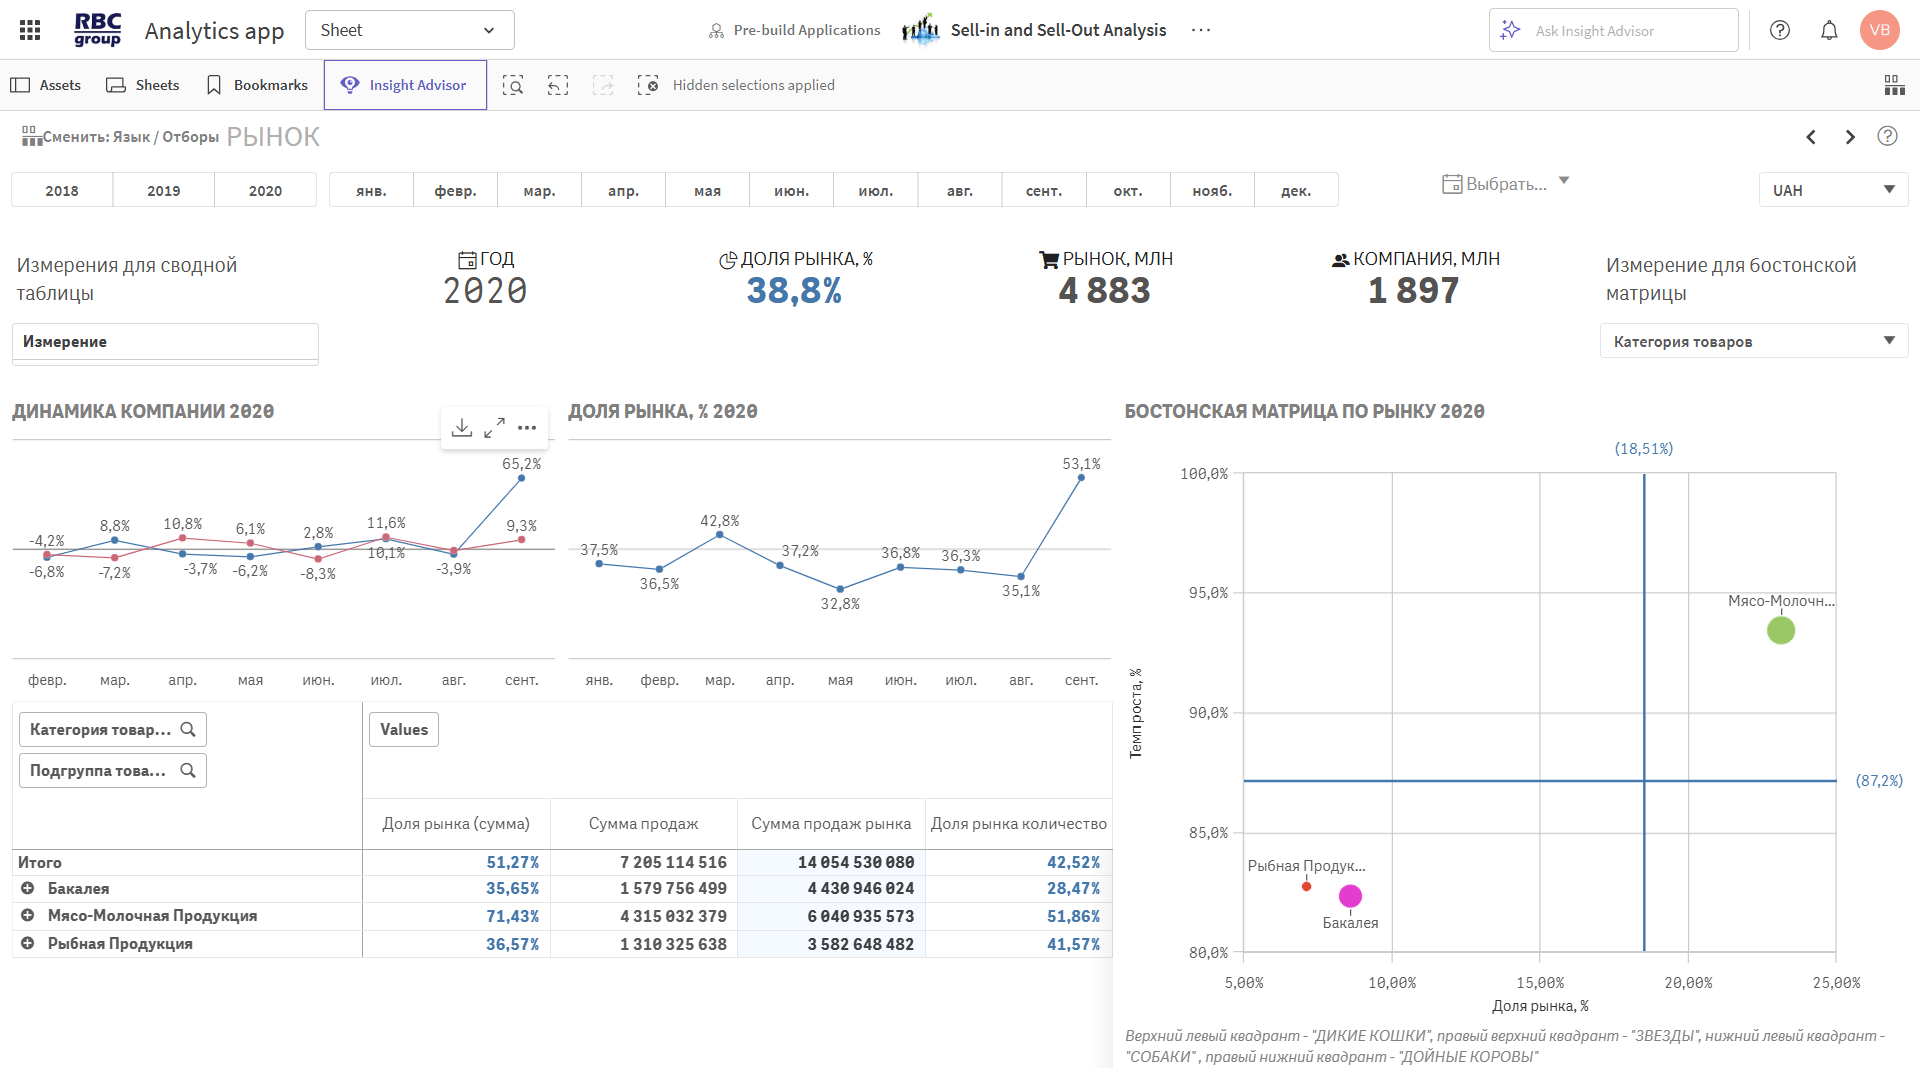
Track competitive positioning and customer engagement.
◾ Market share by value and volume
◾ LFL market share analysis
◾ Sales of products not currently in the product range
◾ Customer activity: new, returning, inactive
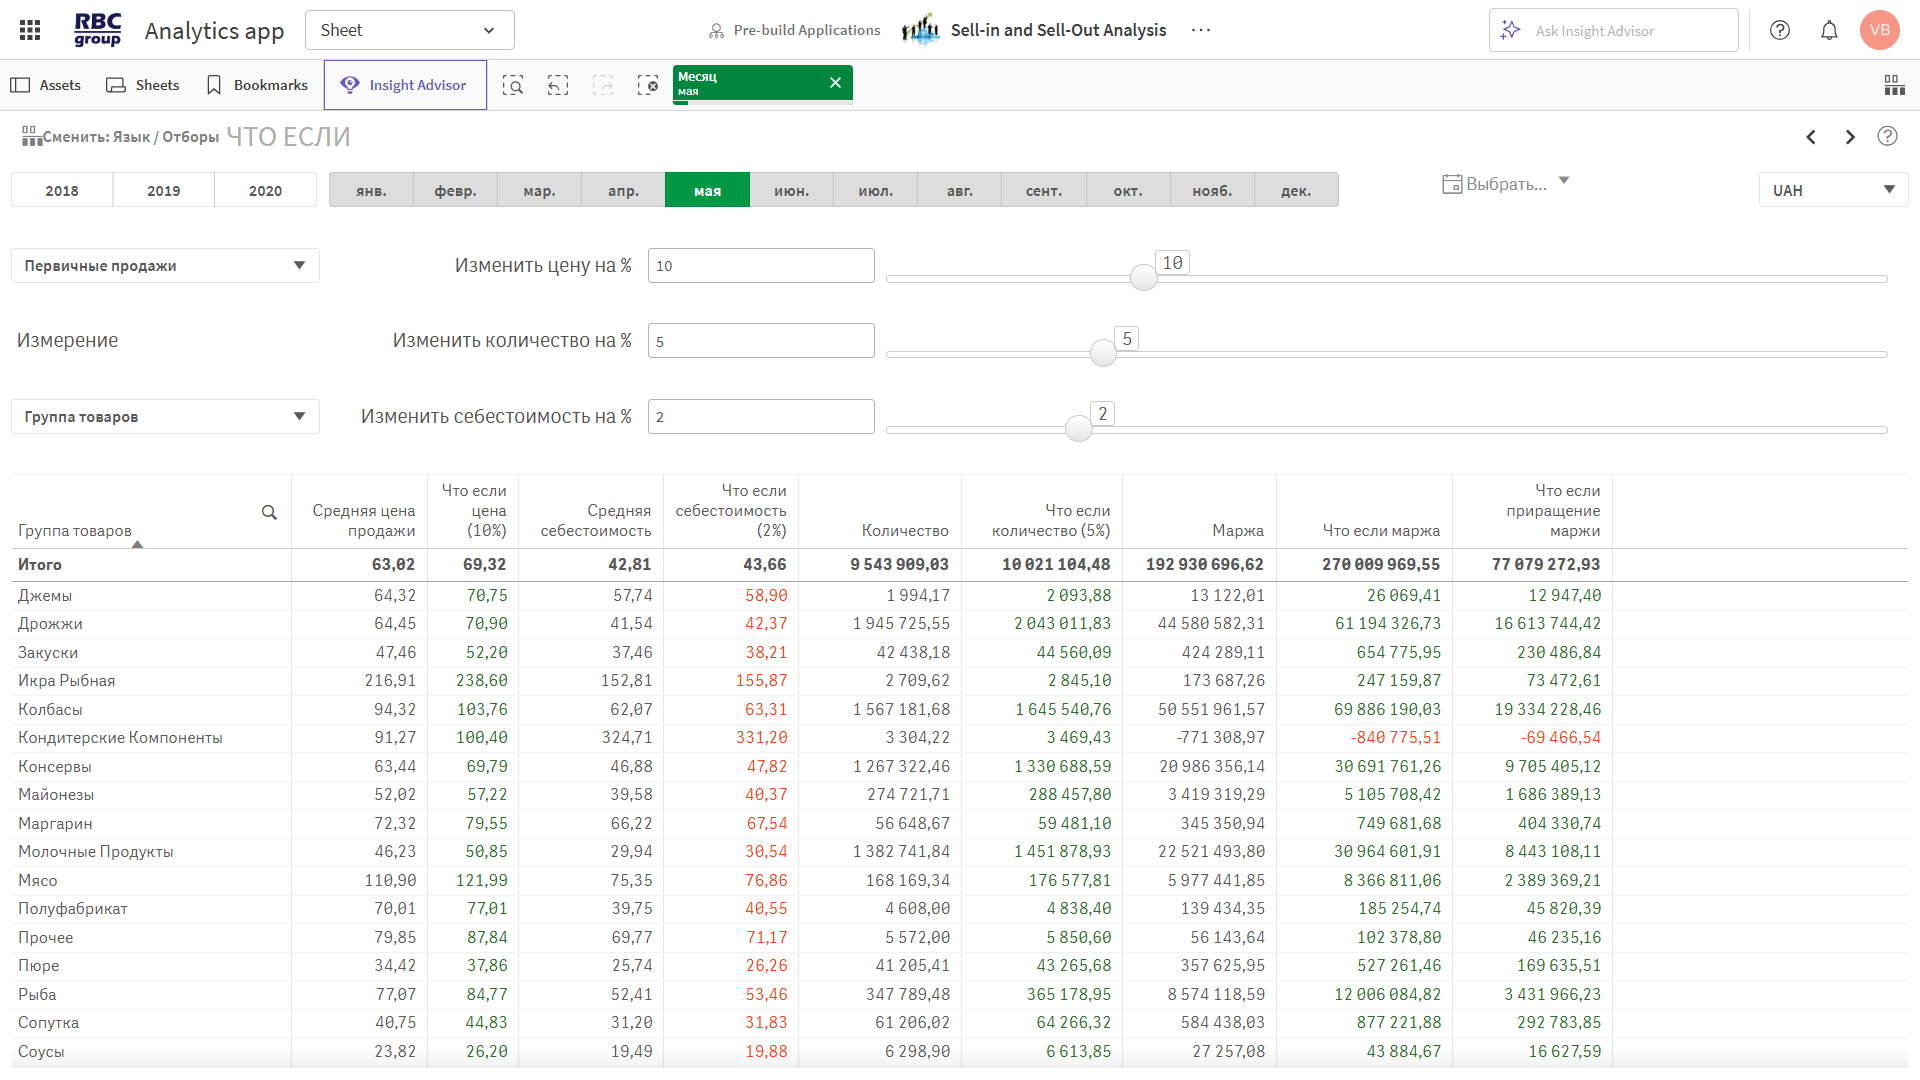
They enable you to model and predict sales and margin trends.
◾ Forecasts of plan fulfillment based on current trends
◾ What-if analysis: how margins will change if prices, costs, or volumes change
BI integrates sales and inventory data from your accounting system with data from distributors. You gain complete visibility into sales, inventory, and market share broken down by region, brand, and channel.
Comparing plans, actual results, and forecasts, along with LFL and factor analysis, helps us understand why margins are declining, where variances are occurring, and which products are losing ground. This allows us to respond more quickly and strengthen high-performing segments.
ABC, XYZ, FMR, geoinformatics, and what-if scenarios make it possible to precisely segment customers, manage product assortments, and model the impact of prices and volumes on profitability.


RBC Group enhances its clients' competitiveness by implementing modern business analytics, data integration and management, artificial intelligence, and advanced analytics systems.


 26
26Современная аналитика — это уже не просто дашборды. Рассказываем, почему бизнесу недостаточно видеть данные и как современные BI-платформы помогают быстрее принимать решения, автоматизировать действия и использовать возможности ИИ.
 35
35Qlik сегодня — это уже не просто BI. На Qlik Community Uzbekistan 2026 участники обсудили будущее аналитики, облачные технологии, интеграцию данных и возможности Agentic AI. Делимся ключевыми выводами и инсайтами мероприятия.
 16
16Почему высокая активность торговых представителей не всегда означает эффективную работу на территории? Рассмотрим ключевые показатели, практические сценарии и подход к управлению торговыми визитами на основе данных.
26Современная аналитика — это уже не просто дашборды. Рассказываем, почему бизнесу недостаточно видеть данные и как современные BI-платформы помогают быстрее принимать решения, автоматизировать действия и использовать возможности ИИ.
35Qlik сегодня — это уже не просто BI. На Qlik Community Uzbekistan 2026 участники обсудили будущее аналитики, облачные технологии, интеграцию данных и возможности Agentic AI. Делимся ключевыми выводами и инсайтами мероприятия.
16Почему высокая активность торговых представителей не всегда означает эффективную работу на территории? Рассмотрим ключевые показатели, практические сценарии и подход к управлению торговыми визитами на основе данных.
Warning: foreach() argument must be of type array|object, false given in /home/rbcgrp/rbcgrp.com/www/wp-content/themes/theme-sp/template/blog.php on line 374

Analysis of primary and secondary sales
Most companies’ marketing strategies are based on maximizing sales. By encouraging distributors to purchase large quantities of products and offering bonuses and discounts to their wholesale customers, manufacturers pay little attention to what happens to the goods afterward. The lack of control over retail outlets leads to inefficient product distribution, logistical problems, lost profits, and difficulties in production planning. In such a situation, the analysis of secondary sales takes on particular importance. Its purpose is to continuously monitor inventory levels at retail outlets, obtain real-time information, and avoid any issues related to product shortages or surpluses.
Why It’s Important to Analyze Primary and Secondary Sales
Primary sales generate revenue for a manufacturing company and constitute its core business. At the same time, they cannot exist in isolation.
For manufacturers, secondary sales are more important than primary sales. The volatility of demand, which leads to the “bullwhip effect,” is a real nightmare for managers responsible for organizing shipments. As a result, the entire planning system at the company breaks down:
- inventory builds up at the distributor level;
- it becomes impossible to plan production effectively;
- cash flow slows down;
- profitability declines.
The analysis of primary and secondary sales must be considered in conjunction with one another. The main challenge in this process is data consolidation. Each counterparty may enter SKU names into its own database differently and provide reports generated in accordance with its own internal standards. IT specialists often have to consolidate the received information manually due to differences in row names and document formats. The more counterparties a manufacturing company has and the greater the number of SKUs it produces, the more time and manpower this process will require.
Valuable information about end consumers is contained in retail sales data, which is generated when end consumers purchase goods. Collecting this data helps the company analyze the effectiveness of its product promotion in specific retail chains and regions. Expanding the scope of this analysis increases the workload for the employees responsible for preparing reports.
Since sales are a dynamic process, the data collected quickly becomes outdated, which compromises the quality of decisions made based on it. Furthermore, any manual tasks involved in generating reports inevitably lead to human errors.
How sales analytics helps manufacturing companies
Modern business analytics platforms enable data to remain constantly up-to-date without the need for manual management. The necessary information received from distributors will be automatically uploaded to a centralized database and adapted to meet its requirements. This eliminates one of the most serious challenges in analyzing a company’s secondary sales: time lag.
When new data is loaded into the database, reports that have been pre-configured to meet management’s needs are automatically updated. Data can be presented in tabular and graphical formats, making it easier to analyze. An important advantage of business analytics platforms is flexibility. The system does not need to be reconfigured when a new counterparty or product is introduced, and the availability of a built-in analysis model such as LFL makes it possible to conduct accurate comparisons across multiple periods.
Using the analytics app allows you to:
- rank distributors based on sales volume;
• evaluate management effectiveness by analyzing trends in key performance indicators (sales volume, cost of goods sold, margin, and others);
• determine the interdependence of primary and secondary sales;
• monitor the order fulfillment process;
• sort distributors and products by importance according to the principles of ABC-XYZ analysis;
• track demand for goods at specific time intervals;
• analyze trends in distributor activity.
The analysis of primary sales can be customized and tailored to the user’s needs. Within the app, you can set the data refresh frequency, customize the appearance of reports, and create your own dashboards featuring the key metrics you need.
What opportunities does the implementation of analytical tools offer businesses?
By collecting data on distributors’ current performance, managers can analyze the organization’s primary sales in terms of their effectiveness:
- evaluate the results of the current product promotion strategy;
- identify ways to increase sales;
- prioritize order fulfillment;
- optimize inventory levels at the manufacturer’s warehouses and at points of sale;
- plan production taking into account the growth of retail chains, demand levels, and seasonal factors;
- compare sales and inventory metrics with previous periods and evaluate the effectiveness of optimization efforts.
Analyzing a company’s primary sales in conjunction with data received from distributors enables the optimization of the planning process by adjusting sales forecasts to reflect current market conditions. As a result of a comprehensive analysis of sales metrics, company executives gain the ability to accurately calculate required production volumes, adjust procurement volumes, and implement operational management of the company’s internal processes in response to changing conditions in the supply chain. Supplementing existing information with tertiary sales data allows for the assessment of marketing effectiveness, brand value, and product competitiveness. Companies that are able to utilize this mechanism can maximize revenue during periods of rising demand and avoid unnecessary costs when demand for their products declines.

